
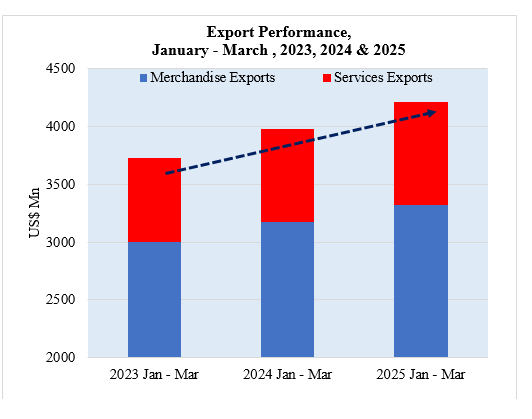
Sri Lanka has demonstrated remarkable resilience and growth in its export sector during the first quarter of 2025, with total exports reaching US$ 4,212.13 Mn, reflecting a robust 5.87% growth compared to the same period last year.
March 2025 proved particularly successful with total exports, including both merchandise and services, reaching US$ 1,507.90 Mn. This represents an impressive 6.24% year-on-year growth compared to March 2024 and a substantial 11.76% month-on-month increase from February 2025.
"This positive export performance underscores Sri Lanka's growing prominence in global trade and reflects the effectiveness of ongoing efforts to enhance the country's export competitiveness and market access," said Mr. Mangala Wijesinghe, Chairman & Chief Executive Officer, Export Development Board. "Our exporters continue to demonstrate remarkable resilience and adaptability in global markets."
The merchandise export sector showed strong performance with a 5.87% year-on-year growth in March 2025, reaching US$ 1,215.9 Mn according to provisional data from Sri Lanka Customs, including estimated figures for Gems & Jewellery and Petroleum Products.
Services exports have been a particular bright spot, with an estimated growth of 7.79% in March 2025, reaching US$ 291.12 million compared to the same period in 2024. For the entire first quarter, services exports are estimated to have increased by 10.88% to US$ 887.04 million, highlighting the growing importance of Sri Lanka's knowledge-based economy.
The services export sector, comprising ICT/BPM, Construction, Financial services, and Transport & Logistics, continues to diversify Sri Lanka's export portfolio and create high-value employment opportunities across the island.
Overall merchandise exports for January to March 2025 are estimated at US$ 3,325.09 Mn, marking a healthy 4.61% increase compared to the first quarter of 2024.
Table 1: Comparison of Product-wise Merchandise Export Performance
Values in US$ Mns
| Exports of Goods & Services | Jan-Mar 2024 | Jan-Mar 2025 | % Growth (24-25) | Mar 2024 | Mar 2025 | % Growth (24-25) |
| Apparel & Textile | 1245.31 | 1383.47 | 11.09 | 443.90 | 495.95 | 11.73 |
| Tea | 354.78 | 370.95 | 4.56 | 124.86 | 138.83 | 11.19 |
| Rubber-based | 268.44 | 251.27 | -6.40 | 97.98 | 93.08 | -5.00 |
| Coconut-based | 203.62 | 257.46 | 26.44 | 79.11 | 100.66 | 27.24 |
| Diamond, Gems & Jewelery | 112.94 | 95.38 | -15.55 | 33.88 | 29.96 | -11.57 |
| Electronics & Electronic Components | 107.14 | 98.49 | -8.07 | 40.74 | 38.72 | -4.96 |
| Spices and Concentrates | 69.44 | 119.04 | 71.43 | 17.10 | 42.11 | 146.26 |
| Processed Food & Beverages | 126.33 | 138.44 | 9.59 | 49.45 | 55.50 | 12.23 |
| Seafood | 63.90 | 48.24 | -24.51 | 20.22 | 16.98 | -16.02 |
| Ornamental Fish | 5.75 | 4.05 | -29.57 | 1.91 | 1.73 | -9.42 |
| Vegetables | 6.08 | 5.51 | -9.38 | 2.02 | 1.76 | -12.87 |
| Fruits | 10.01 | 9.05 | -9.59 | 3.41 | 3.28 | -3.81 |
| Other Export Crops | 17.94 | 12.64 | -29.54 | 7.95 | 4.99 | -37.23 |
| Flowers & Foliage | 3.25 | 2.95 | -9.23 | 0.99 | 1.06 | 7.07 |
| Boat Building | 10.96 | 5.68 | -48.18 | 10.88 | 1.92 | -82.35 |
| Petroleum Products | 279.17 | 230.11 | -17.57 | 101.87 | 75.50 | -25.88 |
| Others | 293.42 | 292.36 | -0.36 | 112.21 | 113.86 | 1.47 |
| Total Merchandize Exports | 3,178.48 | 3,325.09 | 4.61 | 1,148.48 | 1,215.90 | 5.87 |
| ICT/ BPM Services | 318.18 | 352.53 | 10.80 | 111.98 | 114.82 | 2.54 |
| Construction Services | 60.36 | 21.92 | -63.68 | 14.34 | 4.02 | -71.99 |
| Financial Services | 15.05 | 5.71 | -62.06 | 6.17 | 2.10 | -65.96 |
| Transport & Logistics | 406.45 | 506.88 | 24.71 | 137.59 | 170.18 | 23.69 |
| Total Services Exports | 800.04 | 887.04 | 10.88 | 270.07 | 291.12 | 7.79 |
| Total Exports | 3,978.52 | 4,212.13 | 5.87 | 1,418.55 | 1,507.02 | 6.24 |
Table 2: Comparison of Merchandise Export Performance of Top 15 Export Destinations
Values in US$ Mns
|
| Destination | Jan-Mar 2024 | Jan-Mar 2025 | % Growth (24-25) | Mar 2024 | Mar 2025 | % Growth (24-25) |
| 1 | United States | 711.57 | 775.60 | 9.00 | 241.50 | 274.89 | 13.83 |
| 2 | United Kingdom | 239.02 | 250.34 | 4.74 | 88.57 | 98.06 | 10.71 |
| 3 | India | 182.46 | 256.64 | 40.66 | 69.82 | 91.41 | 30.92 |
| 4 | Italy | 157.82 | 152.80 | -3.18 | 57.29 | 57.59 | 0.52 |
| 5 | Germany | 163.94 | 181.53 | 10.73 | 61.93 | 70.68 | 14.13 |
| 6 | United Arab Emirates | 92.47 | 82.11 | -11.20 | 33.03 | 31.42 | -4.87 |
| 7 | Netherlands | 87.83 | 113.20 | 28.89 | 32.18 | 43.12 | 34.00 |
| 8 | France | 60.62 | 65.13 | 7.44 | 22.00 | 22.81 | 3.68 |
| 9 | Canada | 84.26 | 77.96 | -7.48 | 32.53 | 26.48 | -18.60 |
| 10 | China | 61.86 | 69.11 | 11.72 | 23.44 | 23.96 | 2.22 |
| 11 | Australia | 60.95 | 64.20 | 5.33 | 21.57 | 26.89 | 24.66 |
| 12 | Belgium | 55.42 | 59.20 | 6.82 | 20.31 | 21.09 | 3.84 |
| 13 | Turkey | 32.92 | 28.84 | -12.39 | 11.36 | 11.17 | -1.67 |
| 14 | Japan | 44.27 | 44.09 | -0.41 | 13.76 | 16.33 | 18.68 |
| 15 | Switzerland | 43.13 | 43.59 | 1.07 | 16.61 | 13.21 | -20.47 |
|
| Others | 1,099.94 | 1,060.75 | -3.56 | 402.58 | 386.79 | -3.92 |
|
| Total | 3,178.48 | 3,325.09 | 4.61 | 1,148.48 | 1,215.90 | 5.87 |
Table 3: Comparison of Region wise Merchandise Export Performance
Values in US$ Mns
| Region | Jan-Mar 2024 | Jan-Mar 2025 | % Growth (24-25) | Mar 2024 | Mar 2025 | % Growth (24-25) |
| NAFTA | 844.02 | 895.79 | 6.13 | 290.49 | 317.36 | 9.25 |
| European Union (EU) excluding UK | 671.45 | 735.01 | 9.47 | 248.48 | 277.08 | 11.51 |
| South Asia | 280.92 | 336.99 | 19.96 | 103.52 | 116.96 | 12.98 |
| Middle East Countries (excl. Cyprus & Egypt) | 268.61 | 259.57 | -3.37 | 93.56 | 95.30 | 1.86 |
| African Countries | 65.34 | 92.07 | 40.91 | 25.75 | 34.51 | 34.02 |
| ASEAN | 86.48 | 88.87 | 2.76 | 37.66 | 33.21 | -11.82 |
| CIS Countries | 65.27 | 70.38 | 7.83 | 23.28 | 27.73 | 19.12 |
| Others | 896.39 | 846.41 | -5.58 | 325.74 | 313.75 | -3.68 |
| Total Merchandise Exports | 3,178.48 | 3,325.09 | 4.61 | 1,148.48 | 1,215.90 | 5.87 |