
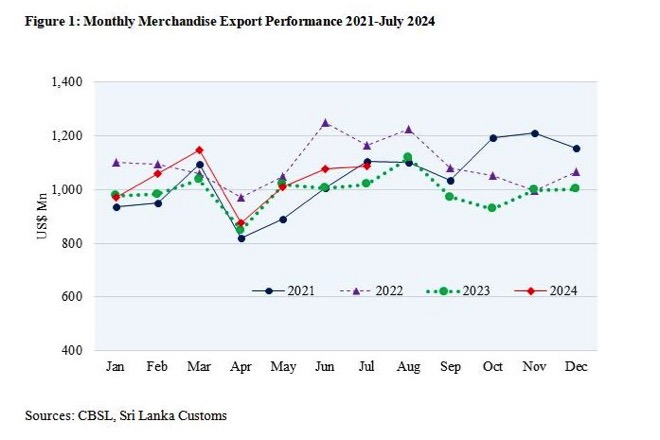
As per the provisional data released by the Sri Lanka Customs, the merchandise export performance in July 2024 amounted to US$ 1,087.6 million, recorded an increase of 6.58 % compared to the month of July 2023. This was mainly due to the increase in earnings from export of Apparel & Textiles, Tea, Coconut based products, Spices & Concentrates and Seafood.
Furthermore, export performance in July 2024 increased by 0.98 % compared to June 2024.
The estimated value of services exports for the month of July 2024 was US$ 293.26 Million, increasing 16.44 % over the corresponding period of 2023.
Consequently, total exports for July 2024, including both merchandise and services, were recorded at US$ 1,380.84 million, increasing 8.53% over the corresponding period of 2023.
Figure I shows Monthly Merchandise export performance from the year 2021 to July 2024.
Table 1: Comparison of Sector-wise Export Performance
Values in US$ Mns
| Exports of Goods & Services | Jan-July 2023 | Jan-July 2024 | % Growth (23-24) | July 2023 | July 2024 | % Growth (23-24) |
| Apparel & Textile | 2,880.61 | 2,846.90 | -1.17 | 427.48 | 443.74 | 3.80 |
| Tea | 750.72 | 811.71 | 8.12 | 115.20 | 124.70 | 8.25 |
| Rubber-based | 529.09 | 575.65 | 8.80 | 79.31 | 76.80 | -3.16 |
| Coconut-based | 402.80 | 475.58 | 18.07 | 63.34 | 75.00 | 18.41 |
| Diamond, Gems & Jewelery | 228.93 | 188.86 | -17.50 | 27.09 | 20.96 | -22.63 |
| Electronics & Electronic Components | 296.58 | 243.49 | -17.90 | 40.82 | 38.44 | -5.83 |
| Spices and Concentrates | 216.73 | 222.03 | 2.45 | 37.53 | 61.20 | 63.07 |
| Processed Food & Beverages | 245.69 | 274.98 | 11.92 | 36.21 | 37.04 | 2.29 |
| Seafood | 149.63 | 150.68 | 0.70 | 17.25 | 22.03 | 27.71 |
| Ornamental Fish | 14.89 | 14.84 | -0.34 | 1.80 | 1.94 | 7.78 |
| Vegetables | 16.82 | 17.29 | 2.79 | 2.08 | 2.31 | 11.06 |
| Fruits | 25.22 | 23.23 | -7.89 | 3.62 | 3.49 | -3.59 |
| Other Export Crops | 50.29 | 40.9 | -18.67 | 12.32 | 4.93 | -59.98 |
| Flowers & Foliage | 8.93 | 8.26 | -7.50 | 1.04 | 0.98 | -5.77 |
| Boat Building | 12.72 | 24.59 | 93.32 | 0.11 | 12.22 | 11009.09 |
| Petroleum Products | 244.03 | 246.39 | 0.97 | 54.25 | 62.23 | 14.71 |
| Others | 817.82 | 1,066.56 | 30.42 | 100.95 | 99.59 | -1.35 |
| Total Merchandize Exports | 6,891.50 | 7,231.94 | 4.94 | 1,020.40 | 1,087.60 | 6.58 |
| ICT/ BPM | 696.55 | 779.76 | 11.95 | 99.25 | 124.96 | 25.91 |
| Construction | 144.56 | 128.10 | -11.39 | 21.56 | 18.80 | -12.81 |
| Financial Services | 35.84 | 42.06 | 17.37 | 4.44 | 8.76 | 97.45 |
| Transport & Logistics | 864.73 | 957.64 | 10.74 | 126.62 | 140.74 | 11.16 |
| Total Services Exports | 1,741.67 | 1,907.56 | 9.52 | 251.86 | 293.26 | 16.44 |
| Total Exports | 8,633.17 | 9,139.50 | 5.86 | 1,272.26 | 1,380.84 | 8.53 |
Sources: CBSL, Sri Lanka Customs
Table 2: Comparison of Merchandise Export Performance of Top 15 Export Destinations
Values in US$ Mns
|
| Destination | Jan-July 2023 | Jan-July 2024 | % Growth (23-24) | July 2023 | July 2024 | % Growth (23-24) |
| 1 | United States | 1,620.57 | 1,638.78 | 1.12 | 253.79 | 267.02 | 5.21 |
| 2 | United Kingdom | 498.25 | 527.01 | 5.77 | 73.42 | 74.40 | 1.33 |
| 3 | India | 493.87 | 491.68 | -0.44 | 81.28 | 92.10 | 13.31 |
| 4 | Italy | 381.23 | 337.89 | -11.37 | 59.02 | 40.26 | -31.79 |
| 5 | Germany | 349.9 | 360.29 | 2.97 | 50.46 | 52.58 | 4.20 |
| 6 | United Arab Emirates | 221.57 | 206.38 | -6.86 | 37.88 | 40.49 | 6.89 |
| 7 | Netherlands | 197.11 | 214.87 | 9.01 | 27.55 | 33.86 | 22.90 |
| 8 | France | 152.25 | 151.15 | -0.72 | 25.03 | 20.68 | -17.38 |
| 9 | Canada | 179.74 | 183.54 | 2.11 | 25.37 | 26.24 | 3.43 |
| 10 | China | 141.7 | 148.48 | 4.78 | 19.22 | 22.45 | 16.81 |
| 11 | Australia | 130.61 | 139.43 | 6.75 | 17.09 | 21.88 | 28.03 |
| 12 | Belgium | 132.51 | 130.73 | -1.34 | 20.89 | 19.9 | -4.74 |
| 13 | Turkey | 112.12 | 82.07 | -26.80 | 19.44 | 15.02 | -22.74 |
| 14 | Japan | 114.9 | 101.26 | -11.87 | 13.97 | 14.09 | 0.86 |
| 15 | Switzerland | 112.87 | 100.98 | -10.53 | 12.16 | 11.43 | -6.00 |
|
| Others | 2052.30 | 2417.40 | 17.79 | 283.83 | 335.20 | 18.10 |
|
| Total | 6,891.50 | 7,231.94 | 4.94 | 1,020.40 | 1,087.60 | 6.58 |
Sources: CBSL, Sri Lanka Customs
Table 3: Comparison of Region wise Merchandise Export Performance
Values in US$ Mns
| Region | Jan-July 2023 | Jan-July 2024 | % Growth (23-24) | July 2023 | July 2024 | % Growth (23-24) |
| United States | 1,620.57 | 1,638.78 | 1.12 | 253.79 | 267.02 | 5.21 |
| European Union (EU) excluding UK | 1,542.68 | 1,533.72 | -0.58 | 230.47 | 221.22 | -4.01 |
| South Asia | 709.05 | 747.49 | 5.42 | 108.45 | 131.36 | 21.12 |
| ASEAN | 597.08 | 579.48 | -2.95 | 95.28 | 96.5 | 1.28 |
| CIS Countries | 190.43 | 169.51 | -10.99 | 27.91 | 26.5 | -5.05 |
| African Countries | 184.66 | 211.28 | 14.42 | 29.88 | 49.67 | 66.23 |
| Middle East Countries (excl. Cyprus & Egypt) | 146.15 | 165.02 | 12.91 | 20.36 | 22.52 | 10.61 |
| Others | 1,900.88 | 2,186.66 | 15.03 | 254.26 | 272.81 | 7.30 |
| Total Merchandise Exports | 6,891.50 | 7,231.94 | 4.94 | 1,020.40 | 1,087.60 | 6.58 |
Sources: CBSL, Sri Lanka Customs