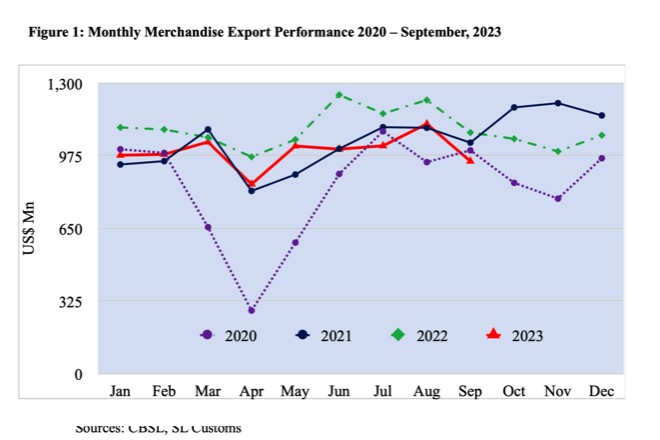
Sri Lanka’s merchandise exports decreased by 11.88 % to US$ 951.5 Million in September 2023 compared to September 2022 as per the provisional data released by Sri Lanka Customs. Also, it is a 14.94 % decrease when compared to the value recorded in August 2023.
The decline in merchandise exports is due to decreased demand for export products, particularly in sectors such as Apparel and textiles, Rubber and rubber-based products, and Coconut and coconut-based products.
Table 1: Comparison of Product-wise Merchandise Export Performance
Values in US$ Mns
| Exports of Goods | Jan-Sept 2022 | Jan-Sept 2023 | % Growth (22-23) | Sept 2022 | Sept 2023 | % Growth (22-23) |
| Apparel & Textile | 4,562.68 | 3,677.38 | -19.40 | 479.87 | 361.82 | -24.60 |
| Tea | 937.13 | 990.31 | 5.67 | 117.81 | 119.96 | 1.82 |
| Rubber-based | 787.87 | 692.16 | -12.15 | 82.18 | 82.89 | 0.86 |
| Coconut-based | 638.58 | 530.99 | -16.85 | 65.87 | 64.31 | -2.37 |
| Diamond, Gems & Jewelery | 293.69 | 306.13 | 4.24 | 58.87 | 39.57 | -32.78 |
| Electronics & Electronic Components | 354.45 | 376.69 | 6.27 | 42.93 | 38.87 | -9.46 |
| Spices and Concentrates | 275.24 | 302.68 | 9.97 | 40.85 | 38.02 | -6.93 |
| Processed Food & Beverages | 319.2 | 322.32 | 0.98 | 28.43 | 30.54 | 7.42 |
| Seafood | 220.86 | 212.40 | -3.83 | 18.68 | 28.19 | 50.91 |
| Ornamental Fish | 15.55 | 19.44 | 25.02 | 1.72 | 2.53 | 47.09 |
| Vegetables | 20.56 | 21.59 | 5.01 | 2.30 | 2.64 | 14.78 |
| Fruits | 27.14 | 32.31 | 19.05 | 3.22 | 3.52 | 9.32 |
| Other Export Crops | 74.38 | 74.62 | 0.32 | 11.35 | 12.95 | 14.10 |
| Flowers & Foliage | 11.40 | 11.07 | -2.89 | 1.35 | 1.20 | -11.11 |
| Boat Building | 6.61 | 67.25 | 917.40 | 0.38 | 0.09 | -76.32 |
| Petroleum Products | 140.95 | 294.81 | 109.16 | 33.26 | 27.22 | -18.16 |
| Others | 1,305.66 | 1,029.47 | -21.15 | 90.76 | 97.20 | 7.10 |
| Total Merchandize Exports | 9,991.95 | 8,961.62 | -10.31 | 1,079.83 | 951.52 | -11.88 |
Sources: CBSL, SL Customs
Table 2: Comparison of Merchandise Export Performance of Top 15 Export Destinations
Values in US$ Mns
|
| Destination | Jan-Sept 2022 | Jan-Sept 2023 | % Growth (22-23) | Sept 2022 | Sept 2023 | % Growth (22-23) |
| 1 | United States | 2,582.91 | 2,074.80 | -19.67 | 274.16 | 202.10 | -26.28 |
| 2 | United Kingdom | 758.93 | 645.74 | -14.91 | 76.37 | 74.98 | -1.82 |
| 3 | India | 642.03 | 655.6 | 2.11 | 71.57 | 79.68 | 11.33 |
| 4 | Germany | 567.93 | 438.41 | -22.81 | 53.18 | 42.11 | -20.82 |
| 5 | Italy | 477.24 | 507.32 | 6.30 | 62.98 | 62.46 | -0.83 |
| 6 | Netherlands | 304.93 | 246.44 | -19.18 | 30.66 | 21.48 | -29.94 |
| 7 | Canada | 281.03 | 230 | -18.16 | 26.45 | 23.10 | -12.67 |
| 8 | UAE | 230.69 | 279.72 | 21.25 | 39.59 | 25.17 | -36.42 |
| 9 | Belgium | 240.22 | 169.98 | -29.24 | 24.73 | 19.22 | -22.28 |
| 10 | France | 199.88 | 248.33 | 24.24 | 22.10 | 21.27 | -3.76 |
| 11 | Australia | 193.23 | 169.25 | -12.41 | 22.66 | 16.88 | -25.51 |
| 12 | China | 185.49 | 176.99 | -4.58 | 20.04 | 15.30 | -23.65 |
| 13 | Japan | 168.74 | 145.2 | -13.95 | 18.42 | 14.36 | -22.04 |
| 14 | Bangladesh | 161.36 | 138.77 | -14.00 | 13.84 | 12.88 | -6.94 |
| 15 | Mexico | 143.95 | 131.66 | -8.54 | 22.44 | 16.16 | -27.99 |
|
| Others | 2,853.39 | 2,703.41 | -5.26 | 300.64 | 304.37 | 1.24 |
|
| Total | 9,991.95 | 8,961.62 | -10.31 | 1,079.83 | 951.52 | -11.88 |
Sources: CBSL, SL Customs
Table 3: Comparison of Region wise Merchandise Export Performance
Values in US$ Mns
| Region | Jan-Sept 2022 | Jan-Sept 2023 | % Growth (22-23) | Sept 2022 | Sept 2023 | % Growth (22-23) |
| United States | 2,582.91 | 2,074.80 | -19.67 | 274.16 | 202.1 | -26.28 |
| European Union (EU) excluding UK | 2,292.26 | 2,044.40 | -10.81 | 247.22 | 215.25 | -12.93 |
| South Asia | 943.36 | 937.71 | -0.60 | 100.63 | 110.54 | 9.85 |
| ASEAN | 750.95 | 818.09 | 8.94 | 99.77 | 93.72 | -6.06 |
| CIS Countries | 233.98 | 246.57 | 5.38 | 24.03 | 30.92 | 28.67 |
| African Countries | 260.58 | 251.75 | -3.39 | 55.30 | 32.34 | -41.52 |
| Middle East Countries (excl. Cyprus & Egypt) | 176.00 | 185.95 | 5.65 | 26.10 | 20.43 | -21.72 |
| Others | 2,751.91 | 2,402.35 | -12.70 | 252.62 | 246.22 | -2.53 |
| Total Merchandise Exports | 9,991.95 | 8,961.62 | -10.31 | 1,079.83 | 951.52 | -11.88 |
Export of Services
The estimated value of services exports for the period of January to September 2023 was US$ 2,304.1 Mn, increasing 55.67 % over the corresponding period of 2022. The services exports estimated by EDB consist of ICT/BPM, Construction, Financial Services, and Transport & Logistics.

