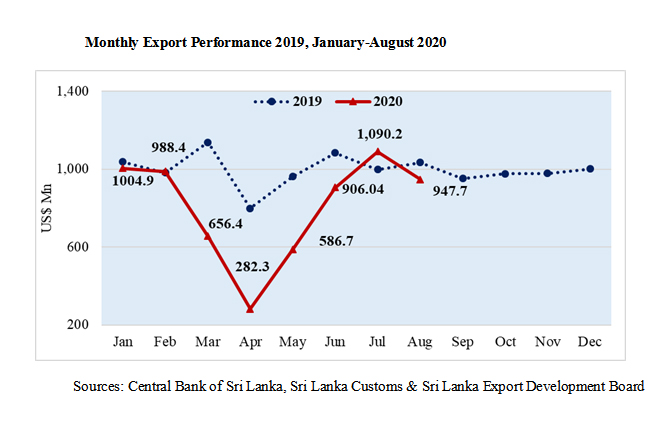
Sep 12, 2020 (LBO) – Sri Lanka’s exports during the month of August 2020 recorded a downfall of 8.3% to US$ 947.7 Mn as compared to the value of US$ 1,033.3 Mn recorded same month of last year.
Despite the decline in exports, some products like Coconut based products, Electricals & Electronic Components, Spices, and Essential Oils and Food & Beverages recorded a positive growth of 22.88%, 8.32%, 19.4%, and 11.45% respectively, during the month of August 2020 as compared to August 2019.
"It is remarkable to see another month of almost a billion dollars of exports. However, we are being watchful of the months ahead whilst understanding the impact of COVID-19 on our key markets of the US and Europe," said Export Development Board (EDB) Chairman Prabhash Subasinghe.
"We also need to focus on export product and market diversification which is seriously lacking today. Whilst appreciating that the US and the EU are the largest markets, we need to now create a significant export market in Asia including China. The China FTA will certainly help in this regard. Export product diversification must simultaneously happen so that we can create more billion-dollar industries for Sri Lanka.”
Table 1 : Merchandise Export Performance (Values in US$ Mns)
| Exports of Goods | Jan.- Aug 2019 | Jan.- Aug 2020 | % Growth | Aug 2019 | Aug 2020 | % Growth |
| Apparel | 3,724.14 | 2,842.03 | -23.69 | 498.03 | 438.33 | -11.99 |
| Tea | 914.99 | 805.56 | -11.96 | 118.74 | 102.98 | -13.27 |
| Rubber-based | 609.87 | 506.77 | -16.91 | 74.56 | 72.51 | -2.75 |
| Coconut-based | 423.50 | 421.70 | -0.43 | 53.15 | 65.31 | 22.88 |
| Diamond, Gems & Jewelry | 197.42 | 98.70 | -50.01 | 22.13 | 13.19 | -40.40 |
| Electricals & Electronic Components | 258.42 | 209.19 | -19.05 | 30.41 | 32.94 | 8.32 |
| Spices and Essential Oils | 204.09 | 195.59 | -4.16 | 33.40 | 39.88 | 19.40 |
| Food & Beverages | 245.86 | 246.17 | 0.13 | 24.90 | 27.75 | 11.45 |
| Seafood | 184.46 | 133.16 | -27.81 | 20.48 | 15.57 | -23.97 |
| Ornamental Fish | 10.14 | 8.45 | -16.67 | 1.01 | 0.63 | -37.62 |
| Vegetables | 21.03 | 17.26 | -17.93 | 2.64 | 1.72 | -34.85 |
| Fruits | 27.06 | 23.18 | -14.34 | 3.31 | 2.95 | -10.88 |
| Other Export Crops | 20.38 | 56.27 | 176.10 | 3.23 | 6.58 | 103.72 |
| Flowers & Foliage | 12.94 | 8.66 | -33.08 | 1.29 | 0.94 | -27.13 |
| Boat Building | 63.75 | 1.91 | -97.00 | 0.14 | 0.27 | 92.86 |
| Petroleum Products | 220.97 | 227.28 | 2.86 | 24.27 | 21.45 | -11.62 |
| Others | 782.14 | 598.33 | -23.50 | 121.61 | 104.68 | -13.92 |
| Total Merchandize Exports | 7,921.16 | 6,400.21 | -19.20 | 1,033.30 | 947.68 | -8.29 |
Sources: Sri Lanka Customs / Sri Lanka Export Development Board
Table 2 : Sri Lanka’s Top Export Destinations (Values in US$ Mns)
| Country | Jan.- Aug 2019 | Jan.- Aug 2020 | % Growth | Aug 2019 | Aug 2020 | % Growth |
| United States of America | 2,083.25 | 1,652.17 | -20.69 | 280.00 | 248.63 | -11.20 |
| United Kingdom | 694.17 | 552.46 | -20.41 | 83.50 | 90.76 | 8.69 |
| India | 517.72 | 396.96 | -23.33 | 64.00 | 57.57 | -10.05 |
| Germany | 440.92 | 371.05 | -15.85 | 58.63 | 58.48 | -0.26 |
| Italy | 353.08 | 280.51 | -20.55 | 44.75 | 47.04 | 5.12 |
| Belgium | 233.91 | 183.27 | -21.65 | 37.28 | 26.51 | -28.89 |
| Netherlands | 193.21 | 172.47 | -10.73 | 25.74 | 25.48 | -1.01 |
| United Arab Emirates | 184.70 | 127.88 | -30.76 | 20.02 | 14.67 | -26.72 |
| Canada | 162.55 | 132.93 | -18.22 | 20.92 | 23.36 | 11.66 |
| China | 154.88 | 138.73 | -10.43 | 17.90 | 24.07 | 34.47 |
| Japan | 214.27 | 127.52 | -40.49 | 15.79 | 17.56 | 11.21 |
| Turkey | 141.93 | 131.61 | -7.27 | 20.66 | 22.35 | 8.18 |
| Other Markets | 2,546.57 | 2,132.65 | -16.25 | 344.11 | 291.20 | -15.38 |
| Total | 7,921.16 | 6,400.21 | -19.20 | 1,033.30 | 947.68 | -8.29 |
Sources: Sri Lanka Customs / Sri Lanka Export Development Board
Export of Services
The services exports estimated by EDB which includes ICT/BPM, Construction, Financial services and Transport & Logistics show exports of US $ 2,224.02 Mn for the period of January to August 2020 compared to US$ 2,584.67 Mn recorded in the corresponding period of the previous year.
However, estimated service exports declined by 13.95 % during the period of January to August 2020 compared with the corresponding period of previous year.

