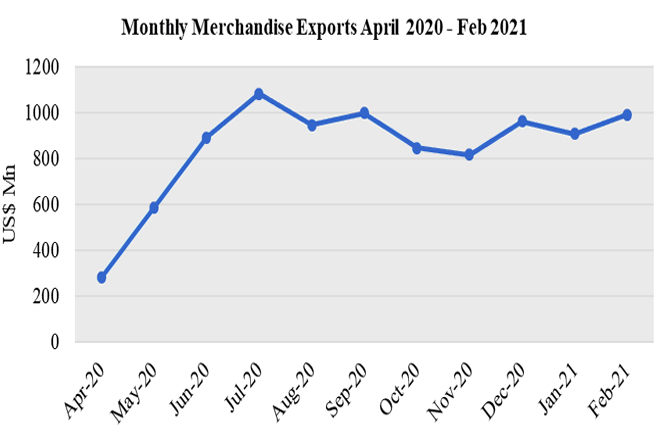
Sri Lanka’s export earnings registered a growth of 2.52% with US$ 993.73 Mn in February, compared to the previous year, maintaining the growth momentum recorded during the last five months as per the provisional statistics released by Sri Lanka Customs. This is the highest export figure recorded for the month of February during the last five-year period.
The growth of exports was supported by increase in global demand notably for products such as Electrical and Electronic components (EEC) and Rubber Gloves. Notable increases in exports were observed to Netherlands, China, Canada and Spain.
Export Development Board (EDB) Chairman Suresh De Mel opined; “Sri Lankans are strong in facing challenges, and the exporters have shouldered the task of placing the economy of the country on the right track with immense difficulties. A tribute to exporters for their commendable performance during unstable circumstances”.

Export Performance of Major Sectors
Table 1 : Export Performance of Major Sectors
| Exports of Goods | Jan-Feb 2020 (US$ Mn) | Jan-Feb 2021 (US$ Mn) | % Growth | % Share to Total Merchandise Exports 2021 |
| Apparel | 938.76 | 862.91 | -8.08 | 45.37 |
| Tea | 207.54 | 213.52 | 2.88 | 11.23 |
| Rubber-based Products | 147.54 | 167.84 | 13.76 | 8.83 |
| Electronics & Electronic Components | 61.26 | 131.63 | 114.87 | 6.92 |
| Coconut-based Products | 98.68 | 114.58 | 16.11 | 6.02 |
| Diamond, Gems & Jewelry | 46.36 | 45.05 | -2.83 | 2.37 |
| Spices and Essential Oils | 38.35 | 75.59 | 97.11 | 3.97 |
| Food & Beverages | 57.51 | 60.66 | 5.48 | 3.19 |
| Seafood | 44.22 | 30.97 | -29.96 | 1.63 |
| Other Export Crops | 16.82 | 6.59 | -60.82 | 0.35 |
| Fruits | 6.93 | 5.50 | -20.63 | 0.29 |
| Vegetables | 4.91 | 3.27 | -33.40 | 0.17 |
| Flowers & Foliage | 2.53 | 2.15 | -15.02 | 0.11 |
| Ornamental Fish | 2.71 | 1.91 | -29.52 | 0.10 |
| Petroleum Products | 77.53 | 1.16 | -98.50 | 0.06 |
| Boat Building | 0.53 | 0.31 | -41.51 | 0.02 |
| Others | 178.33 | 178.15 | -0.10 | 9.37 |
| Total Merchandize Exports | 1,930.51 | 1,901.79 | -1.49 | 100.00 |
Source: Sri Lanka Customs
Sri Lanka’s Export Performance in Major Markets
Table 2: Sri Lanka’s Top 10 Export Destinations
Values in US$ Mns
| Country | Jan - Feb 2020 | Jan - Feb 2021 | % Growth | |
| 1 | United States | 527.90 | 471.79 | -10.63 |
| 2 | United Kingdom | 179.83 | 141.37 | -21.39 |
| 3 | India | 136.61 | 116.23 | -14.92 |
| 4 | Germany | 102.79 | 112.70 | 9.64 |
| 5 | Italy | 85.67 | 97.44 | 13.74 |
| 6 | Belgium | 53.26 | 52.71 | -1.03 |
| 7 | Netherlands | 46.33 | 65.05 | 40.41 |
| 8 | China | 35.84 | 47.71 | 33.12 |
| 9 | Canada | 38.27 | 47.84 | 25.01 |
| 10 | Turkey | 32.76 | 38.02 | 16.06 |
| Other Markets | 691.25 | 710.93 | 2.85 | |
| Total | 1,930.51 | 1,901.79 | -1.49 |
Table 3: Sri Lanka’s Export Regions
Values in US$ Mns
| Region | Jan - Feb 2020 | Jan - Feb 2021 | % Growth |
| European Union (excl. UK) | 411.45 | 532.10 | 29.32 |
| United States | 527.90 | 471.79 | -10.63 |
| South Asia | 205.94 | 167.81 | -18.52 |
| Asean Countries | 68.55 | 37.44 | -45.38 |
| CIS Countries | 47.17 | 44.39 | -5.89 |
| African Countries | 43.22 | 42.91 | -0.72 |
| Middle East Countries (Excl. Cyprus & Egypt) | 137.47 | 120.13 | -12.61 |
| Others | 488.81 | 485.22 | -0.73 |
| Total Merchandise Exports | 1,930.51 | 1,901.79 | -1.49 |
Sources: Sri Lanka Customs / Sri Lanka Export Development Board
Export of Services
The services exports estimated by EDB which includes ICT/BPM, Construction, Financial services and Transport & Logistics show exports of US $ 707.96 Mn for the first two months of 2021 compared to US$ 661.98 Mn recorded in the corresponding period of 2020. 2020. Estimated service exports increased by 6.95% in the period of January to February 2021 compared to the corresponding period of 2020.
