As per the Customs statistics, earnings from merchandise exports recorded a negative growth of 9.64% in January 2021 with US$ 908.07 Mn compared to US$ 1,004.9 Mn recorded in January 2020. The exports which started to grow since last July continued the positive performance till September 2020 with minor contractions with reduced figures from October to December 2020. However, growth in exports in January 2021 is still modest compared to last five years.
Export Performance of Major Sectors

Table 1 : Merchandise Export Performance (Values in US$ Mns)
| Exports of Goods | Jan 2020 | Jan 2021 | % Growth |
| Apparel | 472.07 | 421.28 | -10.76 |
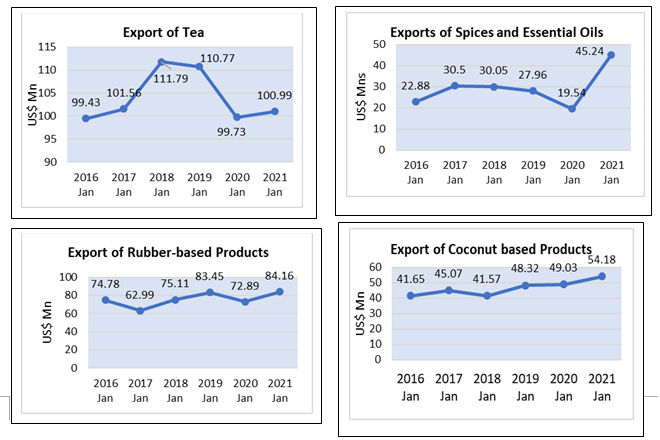
| Tea | 99.73 | 100.99 | 1.26 |
| Rubber-based products | 72.89 | 84.16 | 15.46 |
| Coconut-based products | 49.03 | 54.18 | 10.50 |
| Diamond, Gems & Jewelry | 28.20 | 28.93 | 2.59 |
| Electronics & Electronic Components | 28.23 | 31.85 | 12.82 |
| Spices and Essential Oils | 19.54 | 45.24 | 116.17 |
| Food & Beverages | 27.00 | 31.35 | 16.11 |
| Seafood | 23.66 | 16.91 | -28.53 |
| Ornamental Fish | 1.45 | 0.88 | -39.31 |
| Vegetables | 2.63 | 1.70 | -35.36 |
| Fruits | 3.84 | 2.86 | -25.52 |
| Other Export Crops | 8.19 | 2.47 | -69.84 |
| Flowers & Foliage | 1.05 | 1.09 | 3.81 |
| Boat Building | 0.40 | 0.05 | -87.50 |
| Petroleum Products | 35.64 | 0.46 | -98.71 |
| Others | 131.35 | 83.67 | -36.30 |
| Total Merchandize Exports | 1004.9 | 908.07 | -9.64 |
Sources: Sri Lanka Customs / Sri Lanka Export Development Board
.
.
Sri Lanka’s Trade Performance in Major Markets
Table 2: Sri Lanka’s Top 10 Export Destinations (Values in US$ Mns)
| Country | Jan 2020 | Jan 2021 | % Growth | |
| 1 | United States | 267.61 | 233.53 | -12.73 |
| 2 | United Kingdom | 85.31 | 61.49 | -27.92 |
| 3 | India | 63.21 | 55.65 | -11.96 |
| 4 | Germany | 51.89 | 53.45 | 3.01 |
| 5 | Italy | 45.46 | 53.04 | 16.67 |
| 6 | Belgium | 29.61 | 23.70 | -19.96 |
| 7 | Netherlands | 22.71 | 34.86 | 53.50 |
| 8 | China | 19.25 | 21.98 | 14.18 |
| 9 | Canada | 17.07 | 23.83 | 39.60 |
| 10 | Turkey | 15.13 | 22.37 | 47.85 |
| Other Markets | 387.65 | 324.16 | -16.38 | |
| Total | 1004.9 | 908.07 | -9.64 |
Sources: Sri Lanka Customs / Sri Lanka Export Development Board
.
Table 3: Sri Lanka’s Export Regions (Values in US$ Mns)
| Region | Jan 2020 | Jan 2021 | % Growth |
| European Union | 298.01 (212.70*) | 234.03 | 10.03 |
| United States | 267.61 | 233.53 | -12.73 |
| South Asia | 100.02 | 81.58 | -18.44 |
| Asean Countries | 36.66 | 19.63 | -46.45 |
| CIS Countries | 24.89 | 21.04 | -15.47 |
| African Countries | 18.75 | 17.95 | -4.27 |
| Middle East Countries (Excl. Cyprus & Egypt) | 60.45 | 60.90 | 0.74 |
| Others | 198.51 | 239.41 | 20.60 |
| Total Merchandise Exports | 1004.9** | 908.07 | -9.64 |
*excluding UK ** including UK
Sources: Sri Lanka Customs / Sri Lanka Export Development Board
.
.
Export of Services
The services exports estimated by EDB which includes ICT/BPM, Construction, Financial services and Transport & Logistics show exports of US $ 353.98 Mn for the month of January 2021 compared to US$ 331 Mn recorded in January 2020. Estimated service exports increased by 6.94 % in January 2021 in comparison January 2020.
