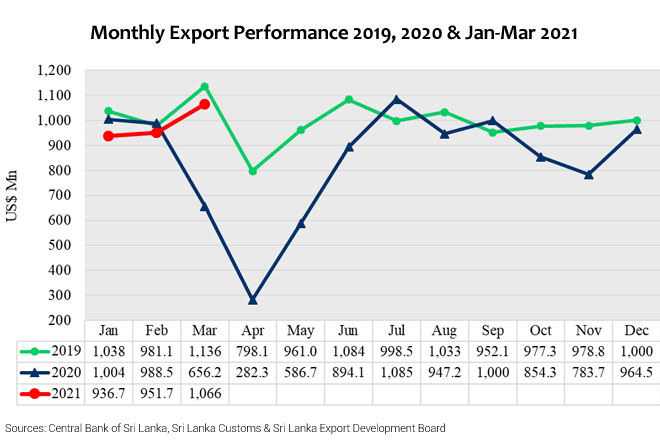
Sri Lanka surpassed US$ 1 billion in exports in March 2021 after a lapse of six months period, the Export Development Board said.
As per the Customs statistics, earnings from merchandise exports recorded double-digit growth of 62.47% in March 2021 on y-o-y comparison – the March figure being US$ 1,066.1 Mn.
Earnings from merchandise exports increased by 11.51% in the first quarter of 2021 to US$ 2,954.53 Mn compared to the first quarter of 2020.
This growth could be attributed to the gradual lifting of Covid 19 restrictions imposed within the country and globally.
Export Development Board (EDB) Chairman Suresh De Mel said; “Sri Lanka’s exports show a remarkable rise despite the current pandemic situation across the World”.
Export Performance of Major Sectors
Table 1: Merchandise Export Performance
Values in US$ Mns
| Exports of Goods | Jan-Mar 2020 | Jan-Mar 2021 | % Growth | Mar 2020 | Mar 2021 | % Growth |
| Apparel | 1,250.86 | 1,328.26 | 6.19 | 312.10 | 465.35 | 49.10 |
| Tea | 270.07 | 338.12 | 25.20 | 62.52 | 124.61 | 99.31 |
| Rubber-based | 203.34 | 268.54 | 32.06 | 55.80 | 100.69 | 80.45 |
| Coconut-based | 136.93 | 194.69 | 42.18 | 38.24 | 80.14 | 109.57 |
| Diamond, Gems & Jewelry | 53.38 | 64.90 | 21.58 | 7.02 | 20.04 | 185.47 |
| Electronics & Electronic Components | 81.95 | 102.04 | 24.51 | 20.70 | 37.90 | 83.09 |
| Spices and Essential Oils | 51.40 | 114.30 | 122.37 | 13.05 | 38.71 | 196.63 |
| Food & Beverages | 86.97 | 92.83 | -15.62 | 29.45 | 32.18 | 9.27 |
| Seafood | 57.00 | 56.36 | -1.12 | 12.76 | 25.41 | 99.14 |
| Ornamental Fish | 3.69 | 3.78 | 2.44 | 0.98 | 1.87 | 90.82 |
| Vegetables | 6.68 | 5.97 | -10.63 | 1.76 | 2.69 | 52.84 |
| Fruits | 9.22 | 9.10 | -1.30 | 2.29 | 3.61 | 57.64 |
| Other Export Crops | 23.03 | 14.16 | -38.51 | 6.20 | 7.56 | 21.94 |
| Flowers & Foliage | 3.95 | 3.72 | -5.82 | 1.41 | 1.57 | 11.35 |
| Boat Building | 0.91 | 0.64 | -29.67 | 0.39 | 0.33 | -15.38 |
| Petroleum Products | 105.73 | 9.95 | -90.59 | 28.20 | 8.80 | -68.79 |
| Others | 304.49 | 347.17 | 14.02 | 63.33 | 114.64 | 81.02 |
| Total Merchandize Exports | 2,649.60 | 2,954.53 | 11.51 | 656.20 | 1,066.10 | 62.47 |
Sources: Sri Lanka Customs / Sri Lanka Export Development Board
Sri Lanka’s Trade Performance in Major Markets
Top 10 Export Destinations
| Country | Jan-Mar 2020 | Jan-Mar 2021 | % Growth | Mar 2020 | Mar 2021 | % Growth | |
| 1 | United States | 708.76 | 715.40 | 0.94 | 180.86 | 243.61 | 34.70 |
| 2 | United Kingdom | 238.76 | 225.90 | -5.39 | 58.93 | 84.53 | 43.44 |
| 3 | India | 173.32 | 193.44 | 11.61 | 36.72 | 77.21 | 110.27 |
| 4 | Germany | 142.25 | 180.17 | 26.66 | 39.47 | 67.47 | 70.94 |
| 5 | Italy | 112.56 | 152.05 | 35.08 | 26.88 | 54.61 | 103.16 |
| 6 | Belgium | 72.85 | 83.22 | 14.23 | 19.59 | 30.51 | 55.74 |
| 7 | Netherlands | 62.87 | 106.78 | 69.84 | 16.54 | 41.73 | 152.30 |
| 8 | China | 47.68 | 77.24 | 62.00 | 11.83 | 29.53 | 149.62 |
| 9 | Canada | 54.81 | 72.14 | 31.62 | 16.54 | 24.29 | 46.86 |
| 10 | Turkey | 43.56 | 54.95 | 26.15 | 10.80 | 16.93 | 56.76 |
| Other Markets | 992.18 | 1,093.24 | 10.19 | 238.04 | 395.68 | 66.22 | |
| Total Merchandise Exports | 2,649.60 | 2,954.53 | 11.51 | 656.20 | 1066.10 | 62.47 |
Sources: Sri Lanka Customs & Sri Lanka Export Development Board
Export Regions
| Region | Jan-Mar 2020 | Jan-Mar 2021 | % Growth | Mar 2020 | Mar 2021 | % Growth |
| EU excluding UK | 559.33 | 733.51 | 31.14 | 147.88 | 268.94 | 81.86 |
| United States | 708.76 | 715.40 | 0.94 | 180.86 | 243.61 | 34.70 |
| South Asia | 261.88 | 282.69 | 7.95 | 55.94 | 114.88 | 105.36 |
| ASEAN Countries | 88.33 | 63.39 | -28.24 | 19.78 | 25.94 | 31.14 |
| CIS Countries | 60.05 | 66.53 | 10.79 | 12.89 | 22.14 | 71.76 |
| African Countries | 56.79 | 74.37 | 30.96 | 13.57 | 31.46 | 131.83 |
| Middle East Countries (Excl. Cyprus & Egypt) | 185.12 | 194.77 | 5.21 | 51.55 | 77.95 | 51.21 |
| Others | 729.34 | 823.87 | 12.96 | 173.73 | 281.18 | 61.85 |
| Total Merchandise Exports | 2,649.60 | 2,954.53 | 11.51 | 656.20 | 1,066.10 | 62.47 |
Sources: Sri Lanka Customs & Sri Lanka Export Development Board
Export of Services
The services exports estimated by EDB which includes ICT/BPM, Construction, Financial Services, and Transport & Logistics show exports of US $ 1,194.3 Mn for the first quarter of 2021 compared to US$ 993 Mn recorded in the corresponding period of 2020. Estimated service exports increased by 20.27% in the first quarter of 2021 compared to the first quarter of 2020.

