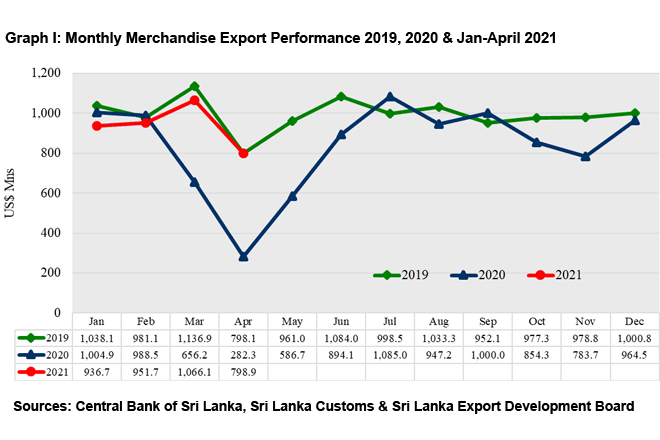
Sri Lanka’s export performance continued its upward momentum in the first three months of 2021. Due to the Covid-19 pandemic-induced lockdown last year, exports were contracted by a record 64.63 percent in April 2020. However in April this year, exports grew up by 183 percent to US$ 798.9 Mn in comparison to the previous year.
This growth could be attributed to the gradual lifting of Covid 19 restrictions imposed within the country and globally. It must be noted that the year-on-year growth in April 2021 was largely due to the negative growth a year ago.
The Export Development Board (EDB) Chairman Suresh de Mel said, “in comparison to the lowest point in April 2020, exports are up by 183% in April 2021. We thank the entire export community for serving the national economic needs at this vulnerable time. The EDB staff and I stand committed to help our exporters through this crisis in the best way possible”.
Export Performance of Major Sectors
Table 1: Merchandise Export Performance
Values in US$ Mns
| Exports of Goods | Jan-Apr 2020 | Jan-Apr 2021 | % Growth (20-21) | April 2020 | April 2021 | % Growth (20-21) |
| Apparel | 1,315.78 | 1,693.31 | 28.69 | 64.91 | 365.04 | 462.38 |
| Tea | 348.44 | 417.38 | 19.79 | 78.37 | 79.26 | 1.14 |
| Rubber-based | 229.11 | 333.28 | 45.47 | 25.77 | 64.74 | 151.22 |
| Coconut-based | 164.81 | 250.49 | 51.99 | 27.88 | 55.76 | 100.00 |
| Diamond, Gems & Jewelry | 54.44 | 92.86 | 70.57 | 1.05 | 27.77 | 2544.76 |
| Electronics & Electronic Components | 91.42 | 129.09 | 41.21 | 9.46 | 27.06 | 186.05 |
| Spices and Essential Oils | 63.49 | 136.76 | 115.40 | 12.09 | 22.46 | 85.77 |
| Food & Beverages | 100.82 | 117.44 | 16.48 | 13.83 | 27.77 | 100.80 |
| Seafood | 63.26 | 75.55 | 19.43 | 6.27 | 19.19 | 206.06 |
| Ornamental Fish | 3.94 | 5.03 | 27.66 | 0.25 | 1.25 | 400.00 |
| Vegetables | 7.92 | 7.83 | -1.14 | 1.24 | 1.87 | 50.81 |
| Fruits | 11.34 | 11.98 | 5.64 | 2.14 | 2.87 | 34.11 |
| Other Export Crops | 24.77 | 19.00 | -23.29 | 1.75 | 4.84 | 176.57 |
| Flowers & Foliage | 4.37 | 4.74 | 8.47 | 0.42 | 1.02 | 142.86 |
| Boat Building | 0.91 | 0.95 | 4.40 | 0.00 | 0.31 | |
| Petroleum Products | 114.41 | 23.42 | -79.53 | 8.69 | 13.46 | 54.89 |
| Others | 254.65 | 380.23 | 49.31 | 28.18 | 84.23 | 198.90 |
| Total Merchandize Exports | 2,853.88 | 3,699.34 | 29.62 | 282.3 | 798.9 | 183.00 |
Sources: Sri Lanka Customs / Sri Lanka Export Development Board
Top 10 Export Destinations
| Country | Jan-Apr 2020 | Jan-Apr 2021 | % Growth (20-21) | April 2020 | April 2021 | % Growth (20-21) | |
| 1 | United States | 759.58 | 920.60 | 21.20 | 50.82 | 205.20 | 303.78 |
| 2 | United Kingdom | 253.65 | 294.23 | 16.00 | 14.89 | 68.34 | 358.97 |
| 3 | India | 184.90 | 247.35 | 33.78 | 11.58 | 53.91 | 365.54 |
| 4 | Germany | 157.76 | 232.20 | 47.19 | 15.51 | 52.03 | 235.46 |
| 5 | Italy | 117.57 | 185.57 | 57.84 | 5.02 | 33.52 | 567.73 |
| 6 | Belgium | 78.70 | 105.47 | 34.02 | 5.85 | 22.26 | 280.51 |
| 7 | Netherlands | 71.60 | 134.99 | 88.53 | 8.74 | 28.21 | 222.77 |
| 8 | China | 58.25 | 96.05 | 64.89 | 10.58 | 18.81 | 77.79 |
| 9 | Canada | 59.19 | 94.51 | 59.67 | 4.39 | 22.37 | 409.57 |
| 10 | Turkey | 52.55 | 65.45 | 24.55 | 8.99 | 10.50 | 16.80 |
| Other Markets | 1,060.13 | 1,322.92 | 24.79 | 145.93 | 283.75 | 94.44 | |
| Total Merchandise Exports | 2,853.88 | 3,699.34 | 29.62 | 282.3 | 798.9 | 183.00 |
Sources: Sri Lanka Customs & Sri Lanka Export Development Board
Export Regions
| Region | Jan-Apr 2020 | Jan-Apr 2021 | % Growth (20-21) | April 2020 | April 2021 | % Growth (20-21) |
| EU excluding UK | 613.11 | 925.95 | 51.03 | 53.78 | 192.43 | 257.81 |
| United States | 759.58 | 920.60 | 21.20 | 50.82 | 205.20 | 303.78 |
| South Asia | 282.55 | 361.01 | 27.77 | 20.66 | 78.32 | 279.09 |
| ASEAN Countries | 101.70 | 89.58 | -11.92 | 13.37 | 26.19 | 95.89 |
| CIS Countries | 79.97 | 82.56 | 3.24 | 19.92 | 16.03 | -19.53 |
| African Countries | 65.85 | 100.05 | 51.94 | 9.06 | 25.68 | 183.44 |
| Middle East Countries (Excl. Cyprus & Egypt) | 216.71 | 243.93 | 12.56 | 31.59 | 49.17 | 55.65 |
| Others | 734.41 | 975.66 | 32.85 | 83.10 | 205.88 | 147.75 |
| Total Merchandise Exports | 2,853.88 | 3,699.34 | 29.62 | 282.3 | 798.9 | 183.00 |
Sources: Sri Lanka Customs & Sri Lanka Export Development Board
Export of Services
The services exports estimated by EDB which includes ICT/BPM, Construction, Financial services and Transport & Logistics show exports of US $ 1,194.3 Mn for the period of January to April 2021 compared to US$ 1,021.9 Mn recorded in the corresponding period of 2020. Estimated service exports increased by 16.87 % in the first four months of 2021 compared to the corresponding period of 2020.

