
Total exports, including both merchandise and services, reached at US$ 1,382.53 Mn in February 2025, marking a notable 4.62% year-on- year growth compared to February 2024. Additionally, exports recorded a 2.58% month-on-month increase compared to January 2025.
According to provisional data from Sri Lanka Customs and estimated figures for Gems & Jewellery and Petroleum Products, merchandise exports for February 2025 were valued at US$ 1,056.39 Mn.
In contrast, services exports for February 2025 were estimated at US$ 326.14 million, marking a significant 24.37% increase over the corresponding period in 2024.
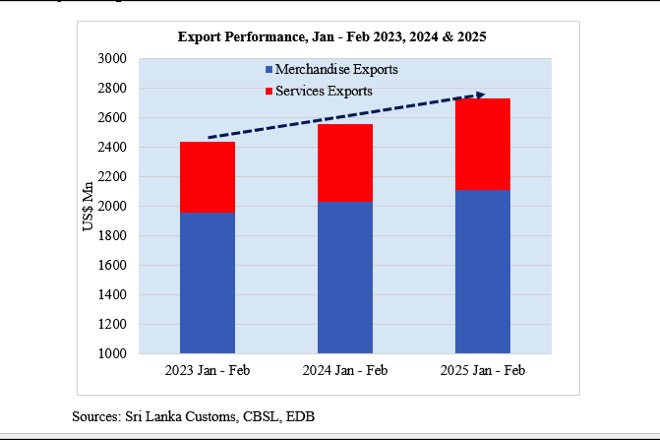
However, cumulative total exports, including both merchandise and services, were estimated at US$ 2,730.33 Mn for period of January to February 2025, marking a notable 6.65 % growth compared to the same period in 2024.
Merchandise exports during the first two months of 2025 are estimated to have increased by 3.9%, reaching US$ 2,109.19 Mn, based on data from Sri Lanka Customs and estimated figures for Gems & Jewellery and Petroleum Products.
Meanwhile, the estimated value of services exports is expected to increase by 17.2% to US$ 621.14 Mn compared to the corresponding period in 2024.
The services exports estimated by EDB consists of ICT/BPM, Construction, Financial services and Transport & Logistics.
Table 1: Comparison of Product-wise Merchandise Export Performance
Values in US$ Mns
| Exports of Goods | Jan-Feb 2024 | Jan-Feb 2025 | % Growth (24-25) | Feb 2024 | Feb 2025 | % Growth (24-25) |
| Apparel & Textile | 801.42 | 887.52 | 10.74 | 421.31 | 427.28 | 1.42 |
| Tea | 229.92 | 232.11 | 0.95 | 127.74 | 119.41 | -6.52 |
| Rubber-based | 170.46 | 158.18 | -7.20 | 88.73 | 83.11 | -6.33 |
| Coconut-based | 124.51 | 156.77 | 25.91 | 68.23 | 82.51 | 20.93 |
| Diamond, Gems & Jewelery | 79.07 | 74.85 | -5.34 | 37.61 | 37.15 | -1.22 |
| Electronics & Electronic Components | 66.40 | 59.76 | -10.00 | 35.16 | 31.33 | -10.89 |
| Spices and Concentrates | 52.32 | 76.92 | 47.02 | 22.99 | 37.93 | 64.98 |
| Processed Food & Beverages | 76.90 | 82.97 | 7.89 | 43.00 | 41.23 | -4.12 |
| Seafood | 43.70 | 31.27 | -28.44 | 20.68 | 13.6 | -34.24 |
| Ornamental Fish | 3.84 | 2.32 | -39.58 | 1.64 | 0.75 | -54.27 |
| Vegetables | 4.05 | 3.73 | -7.90 | 2.05 | 1.33 | -35.12 |
| Fruits | 6.61 | 5.78 | -12.56 | 3.18 | 2.48 | -22.01 |
| Other Export Crops | 9.97 | 7.67 | -23.07 | 5.87 | 4.07 | -30.66 |
| Flowers & Foliage | 2.27 | 1.89 | -16.74 | 1.10 | 0.81 | -26.36 |
| Boat Building | 0.08 | 3.76 | 4,600.00 | 0.02 | 3.68 | 18,300.00 |
| Petroleum Products | 177.33 | 154.12 | -13.09 | 73.50 | 75.09 | 2.16 |
| Others | 181.14 | 169.57 | -6.39 | 106.49 | 94.63 | -11.14 |
| Total Merchandize Exports | 2,030.00 | 2,109.19 | 3.90 | 1,059.30 | 1,056.39 | -0.27 |
| ICT/ BPM | 206.20 | 255.89 | 24.10 | 107.38 | 141.89 | 32.14 |
| Construction | 46.02 | 22.71 | -50.65 | 26.46 | 11.71 | -55.74 |
| Financial Services | 8.88 | 4.07 | -54.18 | 2.04 | 2.07 | 1.47 |
| Transport & Logistics | 268.86 | 338.47 | 25.89 | 126.36 | 170.47 | 34.91 |
| Total Services Exports | 529.97 | 621.14 | 17.20 | 262.24 | 326.14 | 24.37 |
| Total Exports | 2,559.97 | 2,730.33 | 6.65 | 1,321.54 | 1,382.53 | 4.62 |
Sources: CBSL, Sri Lanka Customs, EDB
Table 2: Comparison of Merchandise Export Performance of Top 15 Export Destinations
Values in US$ Mns
|
| Destination | Jan-Feb 2024 | Jan-Feb 2025 | % Growth (24-25) | Feb 2024 | Feb 2025 | % Growth (24-25) |
| 1 | United States | 470.07 | 500.71 | 6.52 | 249.60 | 240.53 | -3.63 |
| 2 | United Kingdom | 150.45 | 152.28 | 1.22 | 82.93 | 72.73 | -12.30 |
| 3 | India | 112.64 | 165.23 | 46.69 | 55.71 | 83.32 | 49.56 |
| 4 | Italy | 100.53 | 95.21 | -5.29 | 50.96 | 49.67 | -2.53 |
| 5 | Germany | 102.01 | 110.86 | 8.68 | 52.68 | 56.98 | 8.16 |
| 6 | United Arab Emirates | 59.44 | 50.69 | -14.72 | 29.60 | 26.16 | -11.62 |
| 7 | Netherlands | 55.64 | 70.09 | 25.97 | 29.62 | 33.46 | 12.96 |
| 8 | France | 38.63 | 42.33 | 9.58 | 21.47 | 20.16 | -6.10 |
| 9 | Canada | 51.73 | 51.48 | -0.48 | 21.28 | 26.00 | 22.18 |
| 10 | China | 38.42 | 45.15 | 17.52 | 20.01 | 23.16 | 15.74 |
| 11 | Australia | 39.38 | 37.31 | -5.26 | 19.63 | 19.22 | -2.09 |
| 12 | Belgium | 35.11 | 38.10 | 8.52 | 19.40 | 18.46 | -4.85 |
| 13 | Turkey | 21.56 | 17.67 | -18.04 | 10.10 | 8.80 | -12.87 |
| 14 | Japan | 30.51 | 27.76 | -9.01 | 17.60 | 13.99 | -20.51 |
| 15 | Switzerland | 26.52 | 30.38 | 14.56 | 13.12 | 12.99 | -0.99 |
|
| Others | 697.36 | 673.94 | -3.36 | 365.59 | 350.76 | -4.06 |
|
| Total | 2,030.00 | 2,109.19 | 3.90 | 1,059.30 | 1,056.39 | -0.27 |
Sources: CBSL, Sri Lanka Customs
Table 3: Comparison of Region wise Merchandise Export Performance
Values in US$ Mns
| Region | Jan-Feb 2024 | Jan-Feb 2025 | % Growth (24-25) | Feb 2024 | Feb 2025 | % Growth (24-25) |
| NAFTA | 553.53 | 578.42 | 4.50 | 286.40 | 282.91 | -1.22 |
| European Union (EU) excluding UK | 422.97 | 457.94 | 8.27 | 227.64 | 230.70 | 1.34 |
| South Asia | 177.40 | 220.03 | 24.03 | 84.45 | 110.12 | 30.40 |
| ASEAN | 48.82 | 55.66 | 14.01 | 23.87 | 27.29 | 14.33 |
| CIS Countries | 42.00 | 42.65 | 1.55 | 22.90 | 23.27 | 1.62 |
| African Countries | 39.59 | 57.56 | 45.39 | 21.65 | 28.31 | 30.76 |
| Middle East Countries (excl. Cyprus & Egypt) | 175.05 | 164.27 | -6.16 | 93.68 | 82.05 | -12.41 |
| Others | 570.64 | 532.66 | -6.66 | 298.71 | 271.74 | -9.03 |
| Total Merchandise Exports | 2,030.00 | 2,109.19 | 3.90 | 1,059.30 | 1,056.39 | -0.27 |
Sources: CBSL, Sri Lanka Customs