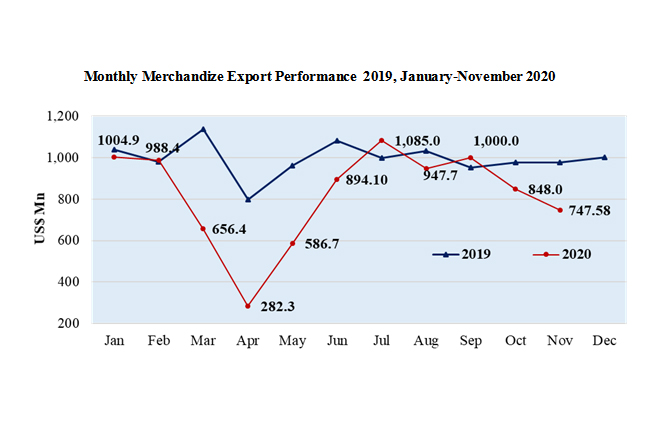
Dec 24, 2020 (LBO) – Export earnings in November 2020 amounted to US$ 748.58 Mn, which was 20.97% lower than November 2019 and 11.84% lower than October 2020, the Export Development Board (EDB) announced.
As per the Customs statistics, earnings from merchandise exports recorded a negative growth of 20.97% in November 2020 to US$ 747.58 Mn as compared to the value of US$ 978.80 Mn recorded in November 2019 due to the adverse impact of 2nd wave of Covid 19 pandemic within the country and globally.
Reduction recorded in October exports due to the Covid 19 outbreak in Sri Lanka which has had a direct impact on our manufacturing and export facilities also continued in November 2020.
Further, adverse global market conditions for Sri Lanka’s key exports were aggravated by the second wave of the COVID-19 pandemic experienced by many countries, leading to low demand for exports of Sri Lanka.
Decreases in exports were recorded top 10 export markets in November 2020 compared to November 2019.
Although exports to the CIS Region recorded a marginal increase in November 2020 compared to November 2019, exports to other regions were declined.
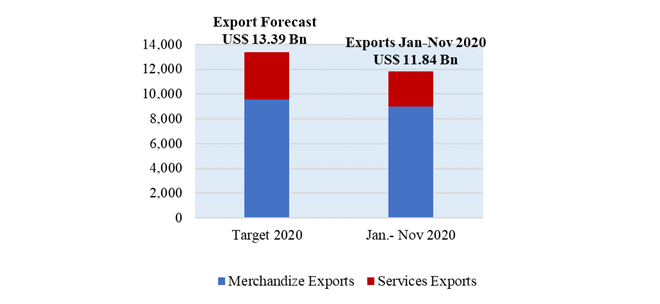
“During the period January to November 2020, earnings from exports recorded US$ 11.84 billion including the estimated services data for July to November which is 88.47% achievement from the revised export target of US$ 13.39 Billion set for 2020. Therefore, our resilient export community and all employees in the export sector should be admired for this remarkable performance in the prevailing crisis situation in the country and globally," EDB Chairman Suresh De Mel said.
"Although the adverse impact of 2nd wave of Covid 19 pandemic on the export sector, Agriculture Exports such as Coconut based, Spices specially Cinnamon were much stronger than expected in November 2020.”
Table 1 : Merchandise Export Performance
Values in US$ Mns
| Exports of Goods | Jan.- Nov. 2019 | Jan.- Nov. 2020 | % Growth | Nov. 2019 | Nov. 2020 | % Growth |
| Apparel | 5,095.79 | 3,955.33 | -22.38 | 483.17 | 324.92 | -32.75 |
| Tea | 1,240.59 | 1,127.98 | -9.08 | 101.46 | 96.21 | -5.17 |
| Rubber-based | 815.45 | 736.68 | -9.66 | 61.75 | 69.57 | 12.66 |
| Coconut-based | 569.51 | 609.68 | 7.05 | 46.14 | 56.92 | 23.36 |
| Gems & Jewellery | 288.01 | 131.74 | -54.26 | 24.89 | 4.78 | -80.80 |
| Electricals & Electronic Components | 352.65 | 292.12 | -17.16 | 28.79 | 25.42 | -11.71 |
| Spices and Concentrates | 292.25 | 302.36 | 3.46 | 24.19 | 34.02 | 40.64 |
| Food & Beverages | 332.99 | 323.78 | -2.77 | 28.26 | 23.26 | -17.69 |
| Seafood | 238.58 | 175.41 | -26.48 | 19.00 | 10.47 | -44.89 |
| Ornamental Fish | 14.01 | 12.07 | -13.85 | 1.18 | 0.81 | -31.36 |
| Vegetables | 28.95 | 23.94 | -17.31 | 2.24 | 2.10 | -6.25 |
| Fruits | 37.90 | 31.13 | -17.86 | 3.30 | 2.26 | -31.52 |
| Other Export Crops | 37.40 | 66.19 | 76.98 | 7.37 | 2.43 | -67.03 |
| Flowers & Foliage | 16.71 | 11.70 | -29.98 | 1.06 | 0.62 | -41.51 |
| Boat Building | 65.28 | 2.16 | -96.69 | 0.04 | 0.13 | 225.00 |
| Petroleum Products | 314.41 | 271.26 | -13.72 | 25.68 | 4.02 | -84.35 |
| Others | 1,054.68 | 907.25 | -13.98 | 120.28 | 89.64 | -25.47 |
| Total Merchandize Exports | 10,795.16 | 8,980.78 | -16.81 | 978.80 | 747.58 | -20.97 |
Sources: Sri Lanka Customs / Sri Lanka Export Development Board
Table 2: Sri Lanka’s Top 10 Export Destinations
Values in US$ Mns
| Country | Jan.- Nov. 2019 | Jan.- Nov. 2020 | % Growth | Nov. 2019 | Nov. 2020 | % Growth | |
| 1 | United States | 2,856.37 | 2,267.48 | -20.62 | 266.91 | 178.27 | -33.21 |
| 2 | United Kingdom | 925.66 | 842.8 | -8.95 | 77.19 | 76.07 | -1.45 |
| 3 | India | 702.98 | 546.49 | -22.26 | 60.06 | 47.70 | -20.58 |
| 4 | Germany | 594.31 | 519.07 | -12.66 | 52.61 | 40.11 | -23.76 |
| 5 | Italy | 490.4 | 406.81 | -17.05 | 44.71 | 35.23 | -21.20 |
| 6 | Belgium | 322.85 | 264.08 | -18.20 | 31.72 | 26.36 | -16.90 |
| 7 | Netherlands | 270.12 | 253.09 | -6.30 | 28.83 | 20.67 | -28.30 |
| 8 | China | 209.07 | 196.82 | -5.86 | 21.06 | 18.82 | -10.64 |
| 9 | Turkey | 192.92 | 186.54 | -3.31 | 18.50 | 13.24 | -28.43 |
| 10 | Canada | 220.04 | 189.49 | -13.88 | 19.28 | 16.91 | -12.29 |
| Other Markets | 4,010.44 | 3,308.11 | -17.51 | 357.93 | 274.2 | -23.39 | |
| Total | 10,795.16 | 8,980.78 | -16.81 | 978.80 | 747.58 | -23.62 |
Sources: Sri Lanka Customs / Sri Lanka Export Development Board
Table 3: Sri Lanka’s Export Regions
Values in US$ Mns
| Country | Jan.- Nov. 2019 | Jan.- Nov. 2020 | % Growth | Nov. 2019 | Nov. 2020 | % Growth |
| European Union | 3,262.80 | 2,882.10 | -11.67 | 286.39 | 250.00 | -12.71 |
| United States | 2,856.37 | 2,267.48 | -20.62 | 266.91 | 178.27 | -33.21 |
| South Asia | 1,031.81 | 833.31 | -19.24 | 90.96 | 69.27 | -23.85 |
| Asean Countries | 374.21 | 259.77 | -30.58 | 30.76 | 17.50 | -43.11 |
| CIS Countries | 253.70 | 249.66 | -1.59 | 19.35 | 19.58 | 1.19 |
| African Countries | 239.79 | 226.51 | -5.54 | 19.86 | 19.15 | -3.58 |
| Middle East Countries (Excl. Cyprus & Egypt) | 835.70 | 643.28 | -23.03 | 70.80 | 50.03 | -29.34 |
| Others | 1,940.78 | 1,618.67 | -16.60 | 193.77 | 143.78 | -25.80 |
| Total | 10,795.16 | 8,980.78 | -16.81 | 978.80 | 747.58 | -23.62 |
Sources: Sri Lanka Customs / Sri Lanka Export Development Board


