
As per the provisional data released by the Sri Lanka Customs, the merchandise export performance in June 2024 amounted to US$ 1,031.2 million, recorded an increase of 2.58 % compared to the month of June 2023. This was mainly due to the increase in earnings from export of Apparel & Textiles, Tea, Rubber based products, Coconut based products, Food & Beverages and Spices & Concentrates.
Furthermore, export performance in June 2024 increased by 1.97 % compared to May 2024.
Figure I shows Monthly Merchandise export performance from the year 2021 to June 2024.
The estimated value of services exports for the month of June 2024 was US$ 323.13 Million, increasing 39.05 % over the corresponding period of 2023.
Consequently, total exports for June 2024, including both merchandise and services, were recorded at US$ 1,354.32 million, increasing 9.42% over the corresponding period of 2023.
Figure 1: Monthly Merchandise Export Performance 2021-June 2024
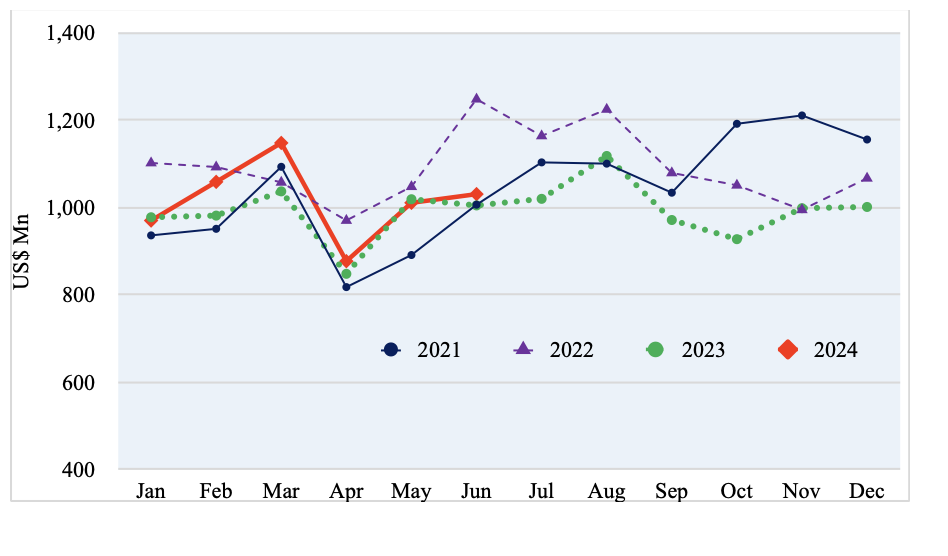
Table 1: Comparison of Sector-wise Export Performance
Values in US$ Mns
| Exports of Goods & Services | Jan-June 2023 | Jan-June 2024 | % Growth (23-24) | June 2023 | June 2024 | % Growth (23-24) |
| Apparel & Textile | 2453.13 | 2403.17 | -2.04 | 428.44 | 446.54 | 4.22 |
| Tea | 635.52 | 687.01 | 8.10 | 111.52 | 121.76 | 9.18 |
| Rubber-based | 449.79 | 498.84 | 10.91 | 73.91 | 82.63 | 11.80 |
| Coconut-based | 339.43 | 400.60 | 18.02 | 58.56 | 67.66 | 15.54 |
| Diamond, Gems & Jewelery | 201.83 | 167.91 | -16.81 | 45.17 | 18.61 | -58.80 |
| Electronics & Electronic Components | 255.80 | 205.02 | -19.85 | 45.09 | 36.21 | -19.69 |
| Spices and Concentrates | 179.21 | 160.85 | -10.24 | 29.46 | 47.91 | 62.63 |
| Processed Food & Beverages | 209.49 | 237.95 | 13.59 | 34.90 | 36.96 | 5.90 |
| Seafood | 132.38 | 128.64 | -2.83 | 17.90 | 20.56 | 14.86 |
| Ornamental Fish | 13.10 | 12.90 | -1.53 | 2.04 | 2.36 | 15.69 |
| Vegetables | 14.74 | 14.97 | 1.56 | 2.35 | 2.97 | 26.38 |
| Fruits | 21.58 | 19.71 | -8.67 | 3.47 | 3.81 | 9.80 |
| Other Export Crops | 7.90 | 7.27 | -7.97 | 1.57 | 1.22 | -22.29 |
| Flowers & Foliage | 37.97 | 35.97 | -5.27 | 10.43 | 5.65 | -45.83 |
| Boat Building | 12.60 | 12.37 | -1.83 | 0.56 | 1.22 | 117.86 |
| Petroleum Products | 189.78 | 184.17 | -2.96 | 27.54 | 38.17 | 38.60 |
| Others | 716.85 | 921.20 | 28.51 | 112.39 | 96.96 | -13.73 |
| Total Merchandize Exports | 5,871.10 | 6,098.55 | 3.87 | 1,005.3 | 1,031.2 | 2.58 |
| ICT/ BPM | 597.14 | 686.64 | 14.99 | 110.44 | 141.64 | 28.25 |
| Construction | 122.99 | 112.44 | -8.58 | 19.49 | 20.44 | 4.89 |
| Financial Services | 31.51 | 36.57 | 16.06 | 4.01 | 10.47 | 161.10 |
| Transport & Logistics | 736.96 | 835.68 | 13.40 | 98.45 | 150.58 | 52.96 |
| Total Services Exports | 1,488.60 | 1,671.33 | 12.28 | 232.39 | 323.13 | 39.05 |
| Total Exports | 7,359.70 | 7,769.88 | 5.57 | 1,237.69 | 1,354.32 | 9.42 |
Sources: CBSL, Sri Lanka Customs
Table 2: Comparison of Merchandise Export Performance of Top 15 Export Destinations
Values in US$ Mns
|
| Destination | Jan-June 2023 | Jan-June 2024 | % Growth (23-24) | June 2023 | June 2024 | % Growth (23-24) |
| 1 | United States | 1,366.78 | 1,371.76 | 0.36 | 226.08 | 254.20 | 12.44 |
| 2 | United Kingdom | 424.83 | 452.61 | 6.54 | 72.52 | 74.88 | 3.25 |
| 3 | India | 412.59 | 399.58 | -3.15 | 67.05 | 87.78 | 30.92 |
| 4 | Italy | 322.21 | 297.63 | -7.63 | 63.03 | 46.71 | -25.89 |
| 5 | Germany | 299.44 | 307.71 | 2.76 | 55.03 | 52.67 | -4.29 |
| 6 | United Arab Emirates | 183.68 | 165.9 | -9.68 | 28.26 | 24.88 | -11.96 |
| 7 | Netherlands | 169.56 | 181.01 | 6.75 | 32.12 | 36.05 | 12.24 |
| 8 | France | 127.22 | 130.46 | 2.55 | 22.7 | 23.47 | 3.39 |
| 9 | Canada | 154.36 | 157.3 | 1.90 | 22.61 | 31.29 | 38.39 |
| 10 | China | 122.48 | 126.04 | 2.91 | 19.24 | 24.83 | 29.05 |
| 11 | Australia | 113.52 | 117.55 | 3.55 | 19.99 | 21.47 | 7.40 |
| 12 | Belgium | 111.62 | 110.83 | -0.71 | 20.11 | 19.46 | -3.23 |
| 13 | Turkey | 92.68 | 67.05 | -27.65 | 16.01 | 11.47 | -28.36 |
| 14 | Japan | 100.94 | 87.17 | -13.64 | 17.24 | 16.03 | -7.02 |
| 15 | Switzerland | 100.7 | 89.55 | -11.07 | 22.82 | 12.83 | -43.78 |
|
| Others | 1768.49 | 2036.40 | 15.15 | 300.49 | 293.18 | -2.43 |
|
| Total | 5,871.10 | 6,098.55 | 3.87 | 1,005.3 | 1,031.2 | 2.58 |
Sources: CBSL, Sri Lanka Customs
Table 3: Comparison of Region wise Merchandise Export Performance
Values in US$ Mns
| Region | Jan-June 2023 | Jan-June 2024 | % Growth (23-24) | June 2023 | June 2024 | % Growth (23-24) |
| United States | 1,366.78 | 1,371.76 | 0.36 | 226.08 | 254.2 | 12.44 |
| European Union (EU) excluding UK | 1,312.21 | 1,312.50 | 0.02 | 240.15 | 227.48 | -5.28 |
| South Asia | 600.59 | 616.13 | 2.59 | 96.44 | 122.78 | 27.31 |
| ASEAN | 501.80 | 482.99 | -3.75 | 95.84 | 76.12 | -20.58 |
| CIS Countries | 162.52 | 143.01 | -12.00 | 20.39 | 24.09 | 18.15 |
| African Countries | 154.78 | 161.60 | 4.41 | 24.93 | 28.07 | 12.60 |
| Middle East Countries (excl. Cyprus & Egypt) | 125.79 | 142.50 | 13.28 | 19.67 | 30.59 | 55.52 |
| Others | 1,646.63 | 1,868.06 | 13.45 | 281.80 | 267.87 | -4.94 |
| Total Merchandise Exports | 5,871.10 | 6,098.55 | 3.87 | 1,005.3 | 1,031.2 | 2.58 |
Sources: CBSL, Sri Lanka Customs
good site for analytics