
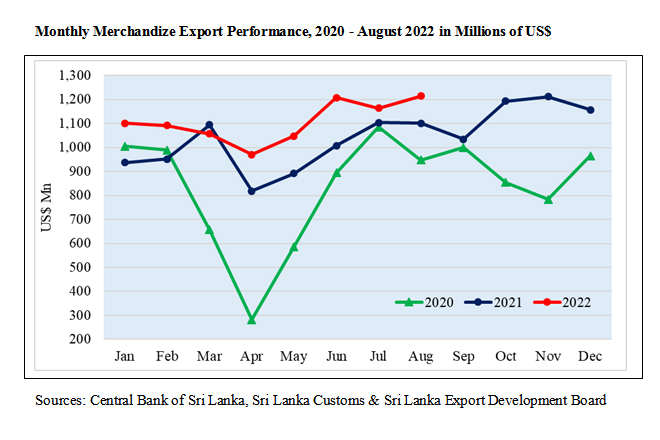
Earnings from the merchandise exports increased by 10.24 % y-o-y to US$ 1,213.7 Mn in August 2022 as per the data released by the Sri Lanka Customs. This was mainly due to the increase in earnings from export of Apparel & Textiles.
The EDB Chairman & CE, Suresh D. de Mel, congratulates the exporters for their great effort to increase foreign exchange earnings for Sri Lanka during this critical period. He also wishes to thank the staff of the EDB and other supporting agencies for their untiring support to facilitate exports under highly disruptive circumstances.
Table 1: Merchandise Export Performance
Values in US$ Mns
| Exports of Goods | Jan-Aug 2020 | Jan- Aug 2021 | Jan- Aug 2022 | % Growth | Aug 2021 | Aug 2022 | % Growth |
| Apparel & Textiles | 2842.03 | 3,422.39 | 4,082.81 | 19.30 | 491.51 | 565.37 | 15.03 |
| Tea | 805.56 | 882.45 | 819.31 | -7.16 | 116.79 | 124.41 | 6.52 |
| Rubber-based | 506.77 | 708.93 | 705.70 | -0.46 | 92.34 | 99.83 | 8.11 |
| Coconut-based | 421.70 | 538.40 | 572.71 | 6.37 | 73.95 | 71.21 | -3.71 |
| Diamond, Gems & Jewelry | 98.70 | 170.58 | 234.83 | 37.67 | 21.79 | 42.54 | 95.23 |
| Electronics & Electronic Components | 209.19 | 278.15 | 311.17 | 11.87 | 36.70 | 41.86 | 14.06 |
| Spices and Essential Oils | 195.59 | 283.43 | 234.39 | -17.30 | 39.79 | 40.11 | 0.80 |
| Food & Beverages | 246.17 | 247.54 | 290.76 | 17.46 | 36.17 | 42.74 | 18.16 |
| Seafood | 133.15 | 165.48 | 188.36 | 13.83 | 18.63 | 25.53 | 37.04 |
| Ornamental Fish | 8.45 | 12.60 | 13.83 | 9.76 | 0.96 | 2.31 | 140.63 |
| Vegetables | 17.26 | 16.60 | 18.26 | 10.00 | 1.93 | 3.14 | 62.69 |
| Fruits & Nuts | 24.50 | 25.52 | 23.92 | -6.27 | 3.62 | 3.96 | 9.39 |
| Other Export Crops | 56.27 | 41.29 | 63.03 | 52.65 | 8.64 | 11.56 | 33.80 |
| Flowers & Foliage | 8.66 | 10.19 | 10.05 | -1.37 | 1.00 | 1.49 | 49.00 |
| Boat Building | 1.91 | 2.82 | 6.23 | 120.92 | 0.15 | 0.36 | 140.00 |
| Petroleum Products | 227.28 | 144.34 | 107.70 | -25.38 | 29.33 | 22.44 | -23.49 |
| Others | 641.71 | 953.32 | 1,170.07 | 22.74 | 127.70 | 114.84 | -10.07 |
| Total Merchandize Exports | 6,444.90 | 7,904.03 | 8,853.13 | 12.01 | 1,101.0 | 1,213.7 | 10.24 |
Table 2: Top 15 Export Destinations
Values in US$ Mns
| Country | Jan-Aug 2020 | Jan- Aug 2021 | Jan- Aug 2022 | % Growth | Aug 2021 | Aug 2022 | % Growth | |
| 1 | United States | 1,652.17 | 1,905.02 | 2,308.75 | 21.19 | 273.66 | 320.31 | 17.05 |
| 2 | United Kingdom | 552.46 | 604.54 | 682.56 | 12.91 | 79.19 | 80.55 | 1.72 |
| 3 | India | 396.96 | 505.88 | 570.46 | 12.77 | 76.41 | 69.71 | -8.77 |
| 4 | Germany | 371.05 | 481.41 | 514.75 | 6.93 | 63.61 | 64.24 | 0.99 |
| 5 | Italy | 280.51 | 373.36 | 414.26 | 10.95 | 48.27 | 55.06 | 14.07 |
| 6 | Netherlands | 172.47 | 270.14 | 274.28 | 1.53 | 38.05 | 40.39 | 6.15 |
| 7 | Canada | 132.93 | 200.65 | 254.58 | 26.88 | 27.27 | 40.57 | 48.77 |
| 8 | Belgium | 183.27 | 214.91 | 215.49 | 0.27 | 28.36 | 29.14 | 2.75 |
| 9 | United Arab Emirates | 127.88 | 180.73 | 191.10 | 5.74 | 28.21 | 29.53 | 4.68 |
| 10 | France | 118.57 | 152.73 | 177.78 | 16.40 | 18.90 | 23.99 | 26.93 |
| 11 | Australia | 106.59 | 165.41 | 170.57 | 3.12 | 23.10 | 27.40 | 18.61 |
| 12 | China | 138.73 | 186.67 | 165.45 | -11.37 | 22.04 | 24.47 | 11.03 |
| 13 | Japan | 127.52 | 135.79 | 150.32 | 10.70 | 19.11 | 29.11 | 52.33 |
| 14 | Bangladesh | 100.20 | 146.04 | 147.51 | 1.01 | 18.81 | 18.18 | -3.35 |
| 15 | Mexico | 81.57 | 126.14 | 121.51 | -3.67 | 18.67 | 22.20 | 18.91 |
| Other Markets | 1,902.02 | 2,254.61 | 2,493.75 | 10.61 | 317.33 | 338.85 | 6.78 | |
| Total | 6,444.90 | 7,904.03 | 8,853.13 | 12.01 | 1,101.0 | 1,213.7 | 10.24 |
Table 3: Export Regions
Values in US$ Mns
| Country | Jan-Aug 2020 | Jan- Aug 2021 | Jan- Aug 2022 | % Growth | Aug 2021 | Aug 2022 | % Growth |
| United States | 1,652.17 | 1,905.02 | 2,308.75 | 21.19 | 273.66 | 320.31 | 17.05 |
| European Union (EU) excluding UK | 1,425.35 | 1,883.07 | 2,045.04 | 8.60 | 248.84 | 276.03 | 10.93 |
| South Asia | 604.59 | 780.37 | 842.74 | 7.99 | 116.69 | 104.99 | -10.03 |
| Middle East Countries (Excl. Cyprus & Egypt) | 475.98 | 558.67 | 624.23 | 11.74 | 86.17 | 98.76 | 14.61 |
| African Countries | 162.51 | 207.59 | 209.95 | 1.14 | 29.29 | 25.56 | -12.73 |
| Asean Countries | 196.79 | 207.27 | 205.28 | -0.96 | 40.40 | 35.70 | -11.63 |
| CIS Countries | 176.08 | 171.60 | 149.90 | -12.65 | 23.11 | 26.72 | 15.62 |
| Others | 1751.43 | 2190.44 | 2467.24 | 12.64 | 282.84 | 325.63 | 15.13 |
| Total Merchandise Exports | 6,444.90 | 7,904.03 | 8,853.13 | 12.01 | 1,101.0 | 1,213.7 | 10.24 |
Export of Services
The estimated value of services exports for the period of Jan-August 2022 was 1,310.05 Million dollars, increasing 5.58 % over the corresponding period of 2021. The services exports estimated by EDB consists of ICT/BPM, Construction, Financial services and Transport & Logistics.