online pharmacy https://buynoprescriptionrxonline.net/med/premarin.html no prescription pharmacy
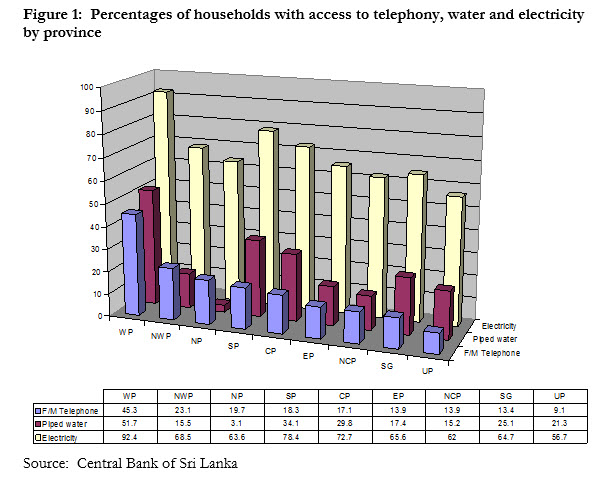
However, in combination with 2001 data from the Telecom Regulatory Commission on the distribution of fixed telephones in Sri Lanka, it is possible to make some broad assertions about how telecom reforms have affected regional disparities. Access First, let us compare the distribution of access to unreformed infrastructure services: water and electricity versus access to the reformed infrastructure service of telephony (fixed and mobile) in 2003-04:
 Not surprisingly, the Western Province is ahead of all others in all three sectors. One would expect the next positions to be held by the Northwestern, Central and Southern provinces. For the most part, they are.
The exceptions are the Northern Province's (actually, Jaffna and Vavuniya districts where the survey was conducted) surprisingly high ranking in telephony (3rd, ahead of the Central Province, which was the traditional runner up in telephony) and the low ranking of the North Western Province in access to piped water (7th, even behind the Eastern Province).
The provincial disparities are highest in piped water to the house (51 per cent of households in the Western Province have access while only 3 per cent do in the Northern Province (Jaffna and Vavuniya districts).
 online pharmacy https://buynoprescriptionrxonline.net/med/vibramycin.html no prescription pharmacy
They are the lowest in access to electricity (92.4 per cent of households in the Western Province versus only 62 per cent in the North Central Province). Leaving aside the horrible quality of service provided by the Electricity Board in the more rural areas, it appears that the unreformed CEB has not done too badly not only in fair allocation of resources, but also in absolute terms. Without exception, more households have access to electricity than to telephones in all the provinces. It must be noted that the CEB insists that it provides electricity to only around 65 per cent of households. Being the monopoly, it should know. But the Central Bank stands by its figures, claiming that at least 5 per cent of households are connected illegally. The CEB employees who aid and abet this illegal activity know this, but understandably do not report the real numbers. Even the piped water picture is not too bleak. After all, it is only in the Northern and North Western provinces that more households have access to telephony than to piped water. But in terms of provincial disparities, piped water is the worst. The ratio between the highest and lowest provinces is 17:1, compared with 5:1 for telephony and 1.
online pharmacy https://buynoprescriptionrxonline.net/med/zoloft.html no prescription pharmacy
5:1 for electricity. Over time? The Central Bank does not have time-series data at the provincial level, so it is not possible to look at how the sectors have done in terms of overcoming provincial disparities. However, a rough indication is available for telecom services.
buy metformin online buy metformin generic
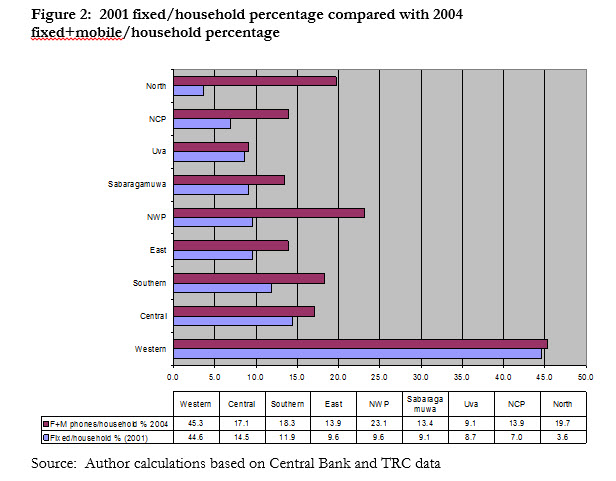
Using 2001-02 data from the Central Bank and the Telecom Regulatory Commission, the percentage of fixed phone per households was calculated. In 2001, the total number of mobile connections was less than one million, or around a quarter of the present number. If anything, the predominantly urban mobile distribution at that time would have exacerbated the disparities in fixed phone connections.
 The changes are stunning.
The Northern Province which was dead last in 2001, is now in third place having increased household penetration by 440 percent (recall that mobiles were prohibited in the North and East prior to the ceasefire, so the comparison is accurate in this case).
The North Western Province which was fifth is now second, with an increase of 142 percent.
 buy caverta online buy caverta generic
The slowest growth is found in the first-place Western Province (1.5 percent) and in last-place Uva (5 percent). In the former, it is clear that the expansion of mobiles, simply added to the number of phones per household whereas in places like the Northern and Northwestern provinces, the mobiles appear to have served as the sole household phone (note that the Central Bank data was collected prior to the spurt in CDMA growth which started in 2005). Even Uva showed growth, with the percentage of households with access to telecom increasing from 8.7 to 9.1. So the spectacular growth in 2001-04 was a tide that raised all boats. But it strikingly favored the laggards as indicated by the narrowing of the gap between the most connected and least connected provinces from 12:1 to 5:1 and by dramatic shuffling of the rank-order, caused by rapid growth in the laggard provinces, except Uva and Sabaragamuwa, which regress further Table 1: Rank order in household access to telephones and household connectivity growth
| Rank order in household access to telephones and household connectivity growth |
|
Rank order 2001 |
Rank order 2004 |
% Growth connected households |
|
|
Western |
1 |
1 |
1.5 |
|
Central |
2 |
5 |
18.3 |
|
Southern |
3 |
4 |
54 |
|
East |
4 |
6 |
45 |
|
NWP |
5 |
2 |
141.7 |
|
Sabaragamuwa |
6 |
8 |
47.2 |
|
Uva |
7 |
9 |
5 |
|
NCP |
8 |
7 |
99.9 |
|
North |
9 |
3 |
439.9 |
buy zovirax online buy zovirax generic
Will there be gamata kiri as in telecom if the government colludes with the JVP in preventing reforms?
