
As per the provisional data released by the Sri Lanka Customs, the merchandise export performance in August 2024 amounted to US$ 1,165.4 million, recorded an increase of 4.18 % compared to the month of August 2023. This was mainly due to the increase in earnings from export of Apparel & Textiles, Tea, Rubber based products, Coconut based products and Spices & Concentrates.
Notably, after a gap of two years, Apparel & Textiles exports surpassed the US$ 500 million mark in August 2024.
Furthermore, export performance in August 2024 increased by 3.1 % compared to July 2024.
The estimated value of services exports for the month of August 2024 was US$ 318.77 Million, increasing 6.49 % over the corresponding period of 2023.
Consequently, total exports for August 2024, including both merchandise and services, were recorded at US$ 1,483.13 million, increasing 4.67 % over the corresponding period of 2023.
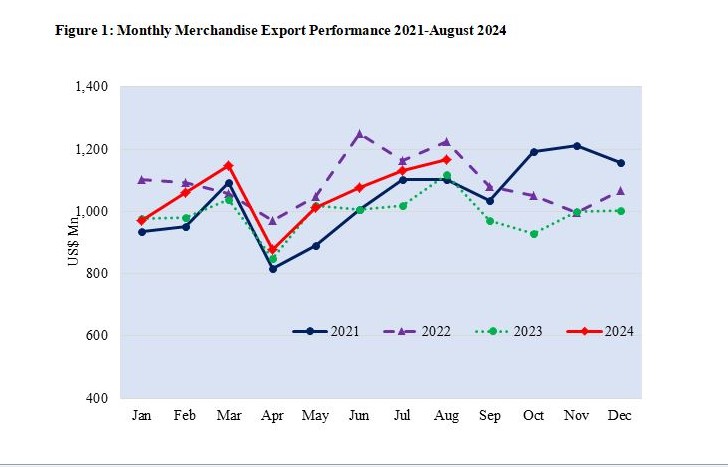
Table 1: Comparison of Sector-wise Export Performance
Values in US$ Mns
| Exports of Goods & Services | Jan-Aug 2023 | Jan-Aug 2024 | % Growth (23-24) | Aug 2023 | Aug 2024 | % Growth (23-24) |
| Apparel & Textile | 3,315.56 | 3,358.05 | 1.28 | 434.98 | 511.13 | 17.51 |
| Tea | 870.37 | 942.26 | 8.26 | 119.64 | 130.54 | 9.11 |
| Rubber-based | 609.26 | 679.43 | 11.52 | 80.16 | 103.79 | 29.48 |
| Coconut-based | 466.67 | 563.99 | 20.85 | 63.89 | 88.36 | 38.30 |
| Diamond, Gems & Jewelery | 266.56 | 214.29 | -19.61 | 37.64 | 25.43 | -32.44 |
| Electronics & Electronic Components | 337.85 | 282.37 | -16.42 | 41.22 | 38.87 | -5.70 |
| Spices and Concentrates | 264.65 | 274.08 | 3.56 | 47.94 | 52.04 | 8.55 |
| Processed Food & Beverages | 291.77 | 315.69 | 8.20 | 46.10 | 40.70 | -11.71 |
| Seafood | 167.30 | 164.54 | -1.65 | 17.66 | 13.86 | -21.52 |
| Ornamental Fish | 16.91 | 16.55 | -2.13 | 2.02 | 1.70 | -15.84 |
| Vegetables | 18.95 | 19.37 | 2.22 | 2.12 | 2.11 | -0.47 |
| Fruits | 28.79 | 27.08 | -5.94 | 3.56 | 3.84 | 7.87 |
| Other Export Crops | 61.68 | 46.39 | -24.79 | 11.38 | 5.49 | -51.76 |
| Flowers & Foliage | 9.87 | 9.23 | -6.48 | 0.95 | 0.98 | 3.16 |
| Boat Building | 67.15 | 24.91 | -62.90 | 54.44 | 0.31 | -99.43 |
| Petroleum Products | 267.59 | 274.87 | 2.72 | 23.56 | 28.47 | 20.84 |
| Others | 949.17 | 1,226.92 | 29.26 | 131.34 | 117.74 | -10.35 |
| Total Merchandize Exports | 8,010.10 | 8,440.02 | 5.37 | 1,118.60 | 1,165.36 | 4.18 |
| ICT/ BPM | 809.53 | 947.46 | 17.04 | 107.73 | 146.26 | 35.76 |
| Construction | 205.10 | 146.44 | -28.60 | 50.40 | 18.84 | -62.62 |
| Financial Services | 40.62 | 43.60 | 7.32 | 4.42 | 7.30 | 64.99 |
| Transport & Logistics | 1033.30 | 1109.27 | 7.35 | 136.79 | 146.37 | 7.01 |
| Total Services Exports | 2088.56 | 2246.77 | 7.58 | 299.35 | 318.77 | 6.49 |
| Total Exports | 10,098.7 | 10,686.8 | 5.82 | 1,418.0 | 1,484.1 | 4.67 |
Sources: CBSL, Sri Lanka Customs
Table 2: Comparison of Merchandise Export Performance of Top 15 Export Destinations
Values in US$ Mns
|
| Destination | Jan-Aug 2023 | Jan-Aug 2024 | % Growth (23-24) | Aug 2023 | Aug 2024 | % Growth (23-24) |
| 1 | United States | 1872.70 | 1939.76 | 3.58 | 252.13 | 300.98 | 19.37 |
| 2 | United Kingdom | 570.76 | 613.56 | 7.50 | 72.51 | 86.54 | 19.35 |
| 3 | India | 575.92 | 577.47 | 0.27 | 82.05 | 85.80 | 4.57 |
| 4 | Italy | 444.86 | 395.69 | -11.05 | 63.63 | 57.80 | -9.16 |
| 5 | Germany | 396.30 | 430.01 | 8.51 | 46.40 | 69.72 | 50.26 |
| 6 | United Arab Emirates | 254.55 | 233.87 | -8.12 | 32.98 | 27.48 | -16.68 |
| 7 | Netherlands | 224.96 | 253.28 | 12.59 | 27.85 | 38.41 | 37.92 |
| 8 | France | 227.06 | 178.49 | -21.39 | 74.81 | 27.35 | -63.44 |
| 9 | Canada | 206.90 | 219.13 | 5.91 | 27.16 | 35.60 | 31.08 |
| 10 | China | 161.69 | 169.86 | 5.05 | 19.99 | 21.38 | 6.95 |
| 11 | Australia | 152.38 | 161.77 | 6.16 | 21.77 | 22.34 | 2.62 |
| 12 | Belgium | 150.76 | 154.58 | 2.53 | 18.25 | 23.85 | 30.68 |
| 13 | Turkey | 134.95 | 94.99 | -29.61 | 22.83 | 12.92 | -43.41 |
| 14 | Japan | 130.83 | 115.83 | -11.47 | 15.93 | 14.57 | -8.54 |
| 15 | Switzerland | 128.46 | 116.92 | -8.98 | 15.59 | 15.95 | 2.31 |
|
| Others | 2377.02 | 2784.81 | 17.16 | 324.72 | 324.67 | -0.02 |
|
| Total | 8,010.10 | 8,440.02 | 5.37 | 1,118.60 | 1,165.36 | 4.18 |
Sources: CBSL, Sri Lanka Customs
Table 3: Comparison of Region wise Merchandise Export Performance
Values in US$ Mns
| Region | Jan-Aug 2023 | Jan-Aug 2024 | % Growth (23-24) | Aug 2023 | Aug 2024 | % Growth (23-24) |
| United States | 1872.70 | 1939.76 | 3.58 | 252.13 | 300.98 | 19.37 |
| European Union (EU) excluding UK | 1829.15 | 1815.49 | -0.75 | 286.47 | 281.77 | -1.64 |
| South Asia | 827.18 | 872.47 | 5.48 | 118.13 | 124.98 | 5.80 |
| ASEAN | 687.49 | 664.02 | -3.41 | 90.40 | 84.54 | -6.48 |
| CIS Countries | 215.65 | 203.62 | -5.58 | 25.22 | 34.11 | 35.25 |
| African Countries | 219.41 | 241.85 | 10.23 | 34.75 | 30.58 | -12.00 |
| Middle East Countries (excl. Cyprus & Egypt) | 165.51 | 186.45 | 12.65 | 19.36 | 21.43 | 10.69 |
| Others | 2193.01 | 2516.36 | 14.74 | 292.14 | 286.97 | -1.77 |
| Total Merchandise Exports | 8,010.10 | 8,440.02 | 5.37 | 1,118.60 | 1,165.36 | 4.18 |
Sources: CBSL, Sri Lanka Customs